
Right-click on images to expand them.
The data set I used yesterday was from Friday. It took a long time to compile it all. I used a single source of reference with only a couple of cross checks for close/open information. I’m looking more closely at each and trying to find a more accurate date for each if needed. This is challenging because there is no standard definition, so I’m using the earliest date that should have some impact for each measure.
Interpretation instructions are found on the previous blog entry.
I’m updating the graphs for the states that were of concern with two more days of data.
The text on each graph is from USA Today. The date listed is their time of update of the text, not the graph.
Alabama

Alaska

Arizona

Arkansas

Florida

Georgia

Iowa

Kansas

Kentucky

Louisiana

Michigan

Mississippi

Missouri

New Mexico

North Carolina

North Dakota

Oklahoma

Oregon

South Carolina

South Dakota

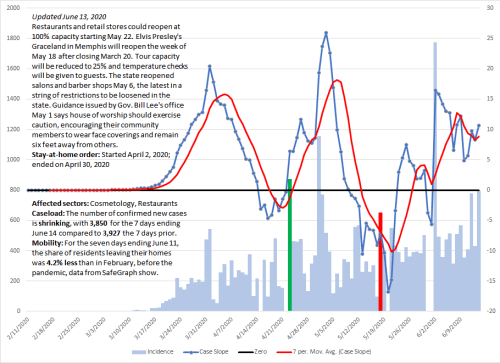
Tennessee
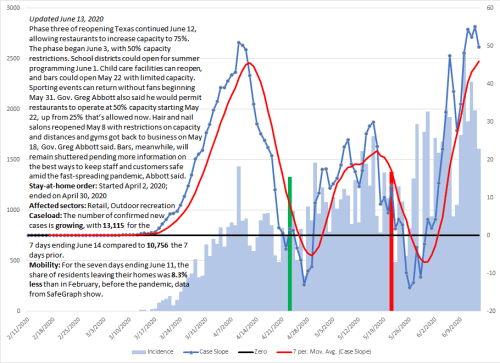
Texas
Utah

Vermont

Virginia

Wisconsin

