
Right click images to see them full size.
The impact of restrictions and relaxation of restrictions is pretty obvious if you look at the data regularly, but it might not be to the casual observer. To illustrate, I’m going to do a series of graphs, ranging in scale from national to metropolitan statistical areas (commonly called metro areas).
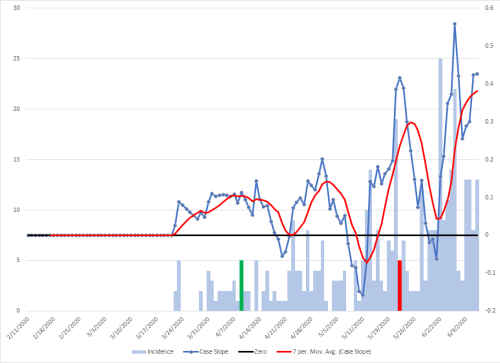
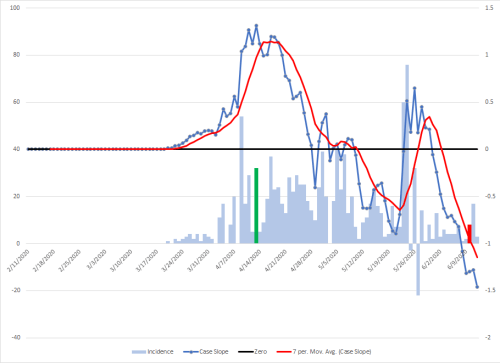
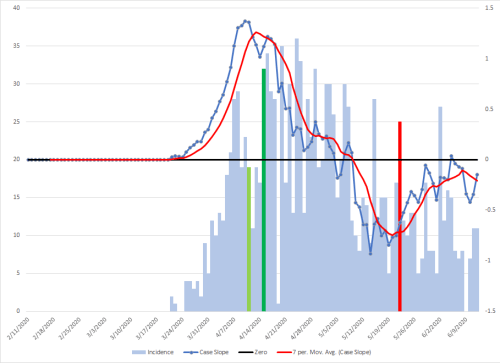
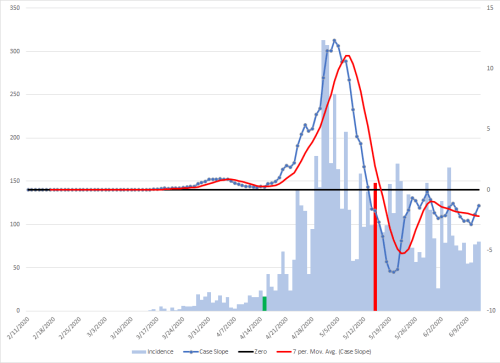
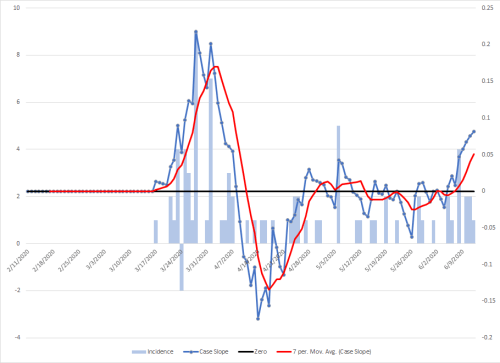
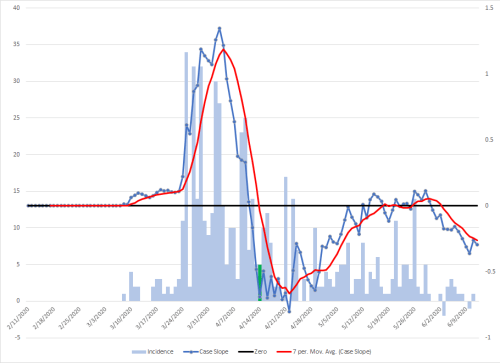
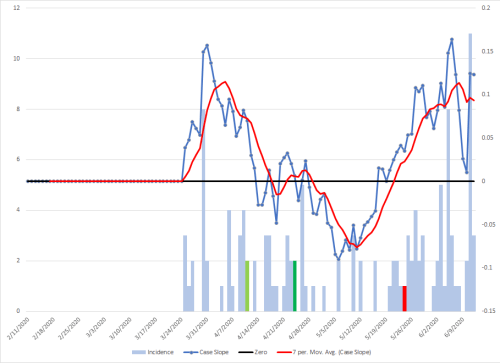
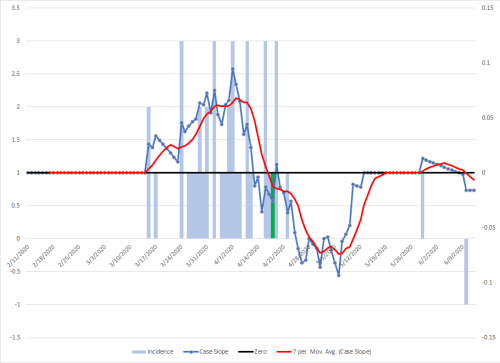
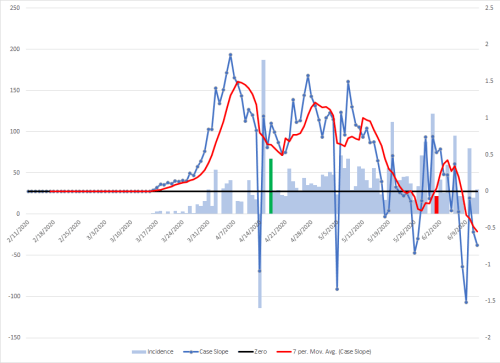
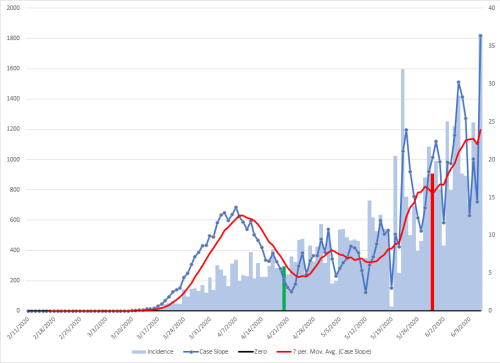
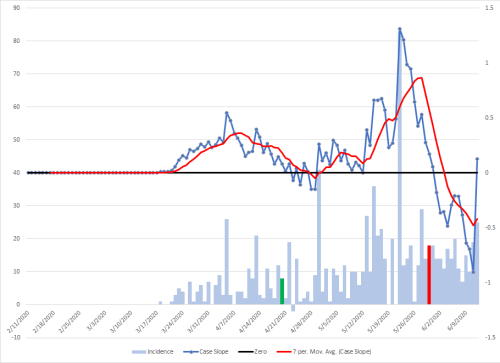
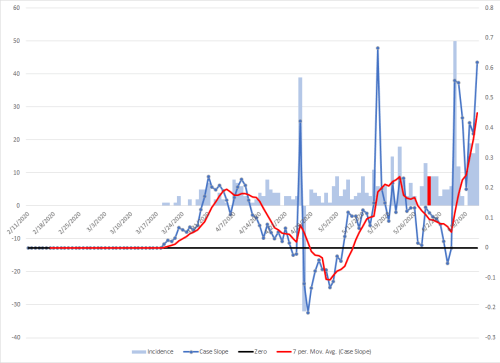
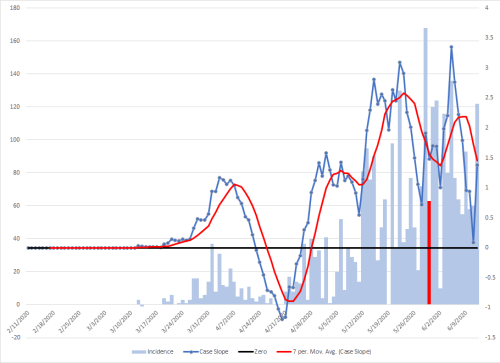
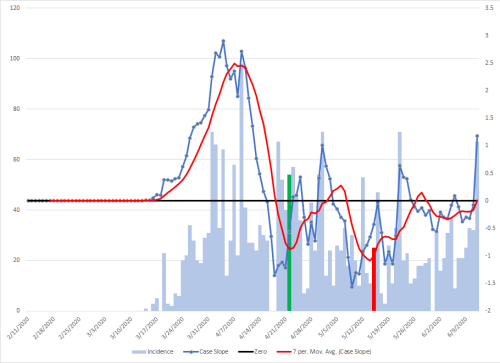
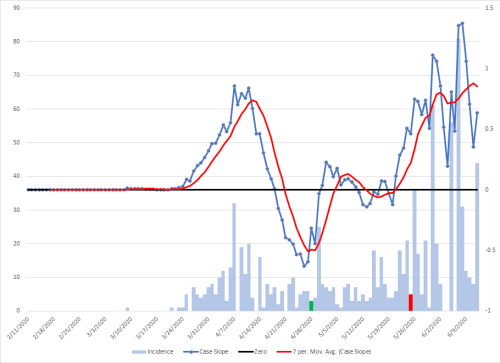
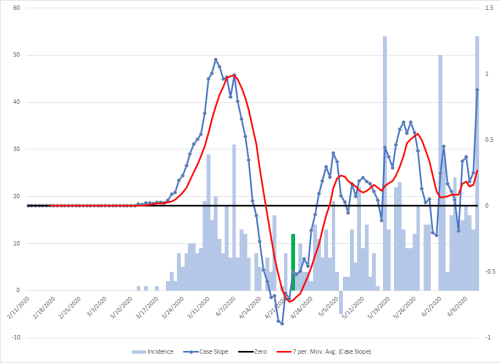
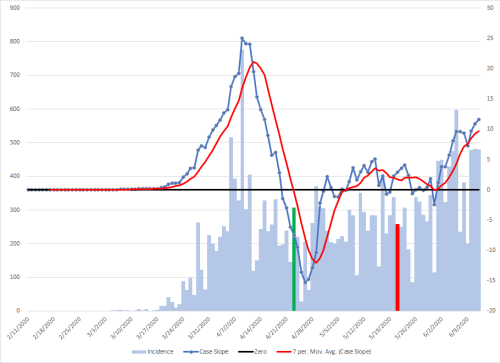
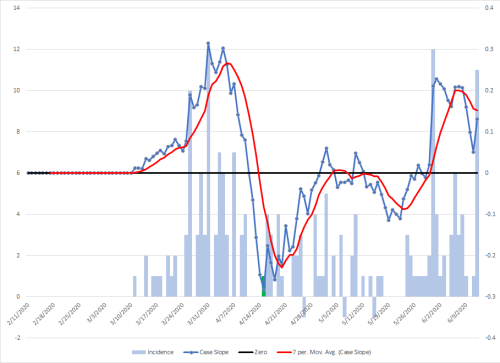
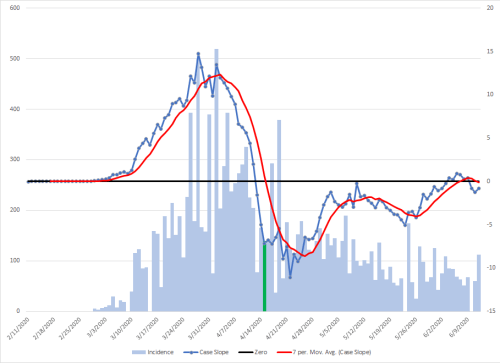
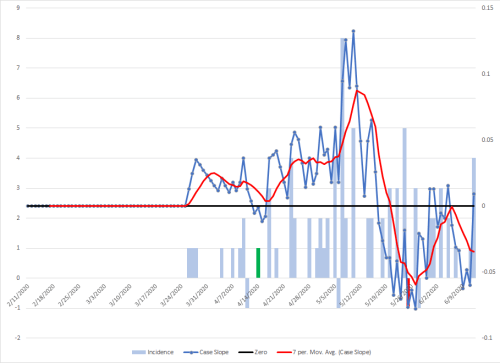
The graphs are going to all have the same format. Cases are plotted on the left y-axis scale and are the light blue bars, the 3-week changing slope is the dark blue line with the points for each day’s retrospective slope, and the red line is the trend of the slope. These are both on the scale on the right axis. When the blue line are above zero (the black line) cases are increasing, when it is below, they are decreasing. The distance vertically from a point on a line to the black zero line is directly proportional to the rate of increase or decrease. The further the distance from that bar, the faster that cases are rising or falling over the prior three weeks.
I’ve added to visual elements to these graphs. The green bar represents three weeks after the date restriction orders were started (or the first in the country on the national map). The red one is three weeks after the relaxation of those orders (or the first state on the national map). When a metro area is in multiple states, the primary city will be red and green, the surrounding areas will be lighter colors.
It’s pretty clear that those orders make a difference. The restriction data is located here, although some searching was needed for a bit of clarification on some. The color bars may not be visible at times if there are no cases that days so look to another one in the same state to identify where it would be. Most states made restrictions statewide.
Note that smaller metropolitan areas may be difficult to interpret because of the lack of a sufficient sample size. There is a seven day oscillation in cases and it may be tempting to make conclusions that are not valid. Also be aware of gaps of no cases followed by a spike. This might be due to delayed reporting of data and will skew trend lines. Also pay attention to the scales as they change significantly between graphs.
There area some areas that are in trouble or have lessons to teach. They are highlighted. States that are highlighted red are close to running out of ICU or hospital beds. If you get infected with this virus in those areas going forward, you may be at risk of not getting a bed. This will become a problem throughout the US in the next few weeks. Do everything you can to avoid unnecessary contact with those outside of your immediate household.
6/15 Update: I suspect the surge in cases that showed up in the hospital bed use graph for Michigan might be due to the weird spike in data that may be an error in the data set. It’s possible that those graphs are generated by an automatic data feed. I’ve pulled it off for now along with the national one that may have been influence by it as well until updated. I’ve left my graphs in because I just pull the data and graph as is. I’m not sure what the methodology is though for the bed use one.
6/15 Update: I’ve also changed the national view to show how there is a cumulative impact related to restrictions and easing. The green bars on the case graph represents restrictions going into place. The darker the bar, the more states that put them in effect that day. The peach bars are the easing of restrictions, with the darker ones indicating more on that day.
Two things should be noted. The closely clustered restrictions brought cases down quickly. The gradual easing of restrictions over time has resulted in a slow uphill trend in cases. Most importantly though, the impact of 15 states that have recently eased up or not removed restrictions does not yet show up in the data.
US

Alabama


Anniston-Oxford, AL

Birmingham-Hoover, AL

Daphne-Fairhope-Foley, AL

Decatur, AL

Dothan, AL

Florence-Muscle Shoals, AL

Gadsden, AL

Huntsville, AL

Mobile, AL

Montgomery, AL – Ran out of ICU beds on May 22 (black bar). This is a good warning about what might happen quickly in smaller metro areas in a rural region.

Tuscaloosa, AL

Alaska


Anchorage, AK

Fairbanks, AK

Arizona


Flagstaff, AZ

Lake Havasu City-Kingman, AZ

Phoenix-Mesa-Chandler, AZ

Prescott Valley-Prescott, AZ

Sierra Vista-Douglas, AZ

Tucson, AZ

Yuma, AZ

Arkansas


Fayetteville-Springdale-Rogers, AR

Fort Smith, AR-OK

Hot Springs, AR

Jonesboro, AR
Little Rock-North Little Rock-Conway, AR

Pine Bluff, AR

California
Reopening varies by county, but following state order unless otherwise noted.

Bakersfield, CA

Chico, CA

El Centro, CA

Fresno, CA

Hanford-Corcoran, CA

Los Angeles-Long Beach-Anaheim, CA – Los Angeles County under stricter orders, Orange County following state (red bar).

Madera, CA

Merced, CA

Modesto, CA

Napa, CA – Remains under restriction.

Oxnard-Thousand Oaks-Ventura, CA – Modified restrictions, but partially following state on 5/29

Redding, CA

Riverside-San Bernardino-Ontario, CA

Sacramento-Roseville-Folsom, CA

Salinas, CA

San Diego-Chula Vista-Carlsbad, CA – remains under restriction.

San Francisco-Oakland-Berkeley, CA – remains under restriction.

San Jose-Sunnyvale-Santa Clara, CA – San Benito county following state order (red bar), Santa Clara county locked down.

San Luis Obispo-Paso Robles, CA

Santa Cruz-Watsonville, CA – remains under restriction.

Santa Maria-Santa Barbara, CA

Santa Rosa-Petaluma, CA – remains under restriction.

Stockton, CA

Vallejo, CA – remains under restriction.

Visalia, CA

Yuba City, CA

Colorado

Boulder, CO

Colorado Springs, CO

Denver-Aurora-Lakewood, CO

Fort Collins, CO

Grand Junction, CO

Greeley, CO

Pueblo, CO

Connecticut

Bridgeport-Stamford-Norwalk, CT

Hartford-East Hartford-Middletown, CT

New Haven-Milford, CT

Norwich-New London, CT
Worcester, MA-CT

Delaware

Dover, DE

District of Columbia
Outcomes of easing restrictions will not be visible until after June 19.

Washington-Arlington-Alexandria, DC-VA-MD-WV

Florida


Cape Coral-Fort Myers, FL

Crestview-Fort Walton Beach-Destin, FL

Deltona-Daytona Beach-Ormond Beach, FL

Gainesville, FL

Homosassa Springs, FL

Jacksonville, FL

Lakeland-Winter Haven, FL

Miami-Fort Lauderdale-Pompano Beach, FL

Naples-Marco Island, FL

North Port-Sarasota-Bradenton, FL

Ocala, FL

Orlando-Kissimmee-Sanford, FL

Palm Bay-Melbourne-Titusville, FL

Panama City, FL

Pensacola-Ferry Pass-Brent, FL

Port St. Lucie, FL

Punta Gorda, FL

Sebastian-Vero Beach, FL

Sebring-Avon Park, FL

Tallahassee, FL

Tampa-St. Petersburg-Clearwater, FL

The Villages, FL

Georgia


Albany, GA

Athens-Clarke County, GA

Atlanta-Sandy Springs-Alpharetta, GA

Augusta-Richmond County, GA-SC

Brunswick, GA

Columbus, GA-AL

Dalton, GA

Gainesville, GA

Hinesville, GA

Macon-Bibb County, GA

Rome, GA

Savannah, GA

Valdosta, GA

Warner Robins, GA

Hawaii

Kahului-Wailuku-Lahaina, HI

Urban Honolulu, HI

Idaho

Boise City, ID

Coeur d’Alene, ID

Idaho Falls, ID

Lewiston, ID-WA

Pocatello, ID

Twin Falls, ID

Illinois
Outcomes of easing restrictions will not be visible until after June 19.

Bloomington, IL

Carbondale-Marion, IL

Chicago-Naperville-Elgin, IL-IN-WI

Danville, IL

Decatur, IL

Kankakee, IL

Peoria, IL

Rockford, IL

Springfield, IL

Indiana

Bloomington, IN

Columbus, IN

Elkhart-Goshen, IN

Evansville, IN-KY

Fort Wayne, IN

Indianapolis-Carmel-Anderson, IN

Kokomo, IN

Lafayette-West Lafayette, IN

Michigan City-La Porte, IN

Muncie, IN

South Bend-Mishawaka, IN-MI

Terre Haute, IN

Iowa


Ames, IA

Cedar Rapids, IA

Davenport-Moline-Rock Island, IA-IL
Des Moines-West Des Moines, IA
Dubuque, IA

Iowa City, IA

Sioux City, IA-NE-SD

Waterloo-Cedar Falls, IA

Kansas


Lawrence, KS
Manhattan, KS

Topeka, KS

Wichita, KS

Kentucky


Bowling Green, KY

Elizabethtown-Fort Knox, KY

Lexington-Fayette, KY

Louisville/Jefferson County, KY-IN

Owensboro, KY

Louisiana


Baton Rouge, LA

Hammond, LA

Houma-Thibodaux, LA

Lafayette, LA

Lake Charles, LA

Monroe, LA

New Orleans-Metairie, LA

Shreveport-Bossier City, LA

Maine
Outcomes of easing restrictions will not be visible until after June 22.

Bangor, ME

Lewiston-Auburn, ME

Portland-South Portland, ME

Maryland
State eased restrictions on May 15th but many counties maintaining stricter controls, particularly in the DC area. Red line represents three weeks after state eases restrictions.

Baltimore-Columbia-Towson, MD

California-Lexington Park, MD

Cumberland, MD-WV

Hagerstown-Martinsburg, MD-WV

Salisbury, MD-DE

Massachusetts
Outcomes of easing restrictions will not be visible until after June 22.

Barnstable Town, MA

Boston-Cambridge-Newton, MA-NH

Pittsfield, MA
Springfield, MA

Worcester, MA-CT

Michigan?
Outcomes of easing restrictions will not be visible until after June 24.

Ann Arbor, MI

Battle Creek, MI

Bay City, MI

Detroit-Warren-Dearborn, MI

Flint, MI

Grand Rapids-Kentwood, MI

Jackson, MI

Kalamazoo-Portage, MI

Lansing-East Lansing, MI

Midland, MI

Monroe, MI

Muskegon, MI

Niles, MI

Saginaw, MI

Minnesota

Duluth, MN-WI

Mankato, MN

Minneapolis-St. Paul-Bloomington, MN-WI

Rochester, MN

St. Cloud, MN

Mississippi


Gulfport-Biloxi, MS

Hattiesburg, MS

Jackson, MS

Missouri


Cape Girardeau, MO-IL
Columbia, MO

Jefferson City, MO

Joplin, MO

Kansas City, MO-KS

Springfield, MO

St. Joseph, MO-KS

St. Louis, MO-IL

Montana

Billings, MT

Great Falls, MT

Missoula, MT
Nebraska – No orders.

Grand Island, NE

Lincoln, NE

Omaha-Council Bluffs, NE-IA

Nevada

Carson City, NV

Las Vegas-Henderson-Paradise, NV

Reno, NV

New Hampshire

Manchester-Nashua, NH
New Jersey
Outcomes of easing restrictions will not be visible until after July 6.

Atlantic City-Hammonton, NJ

Ocean City, NJ

Trenton-Princeton, NJ

Vineland-Bridgeton, NJ

New Mexico

Outcomes of easing restrictions will not be visible until after June 21.

Albuquerque, NM

Farmington, NM

Las Cruces, NM

Santa Fe, NM

New York
Outcomes of easing restrictions will not be visible until after July 1.

Albany-Schenectady-Troy, NY

Binghamton, NY

Buffalo-Cheektowaga, NY

Elmira, NY

Glens Falls, NY

Ithaca, NY

Kingston, NY

New York-Newark-Jersey City, NY-NJ-PA

Poughkeepsie-Newburgh-Middletown, NY

Rochester, NY

Syracuse, NY

Utica-Rome, NY

Watertown-Fort Drum, NY

North Carolina

Asheville, NC
Burlington, NC

Charlotte-Concord-Gastonia, NC-SC

Durham-Chapel Hill, NC

Fayetteville, NC

Goldsboro, NC

Greensboro-High Point, NC

Greenville, NC
Hickory-Lenoir-Morganton, NC

Jacksonville, NC

Myrtle Beach-Conway-North Myrtle Beach, SC-NC

New Bern, NC

Raleigh-Cary, NC

Rocky Mount, NC

Virginia Beach-Norfolk-Newport News, VA-NC

Wilmington, NC

Winston-Salem, NC
North Dakota – No orders


Bismarck, ND

Fargo, ND-MN\

Grand Forks, ND-MN

Ohio

Akron, OH

Canton-Massillon, OH

Cincinnati, OH-KY-IN

Cleveland-Elyria, OH

Columbus, OH

Dayton-Kettering, OH

Lima, OH

Mansfield, OH

Springfield, OH

Toledo, OH

Youngstown-Warren-Boardman, OH-PA

Oklahoma – No orders


Enid, OK

Lawton, OK

Oklahoma City, OK
Tulsa, OK

Oregon

Relaxing of rules varied by county. The red bar indicates the effect of the earliest openings. Increasing cases stopped any additional counties from opening on June 12.

Albany-Lebanon, OR

Bend, OR

Corvallis, OR

Eugene-Springfield, OR

Grants Pass, OR

Medford, OR

Portland-Vancouver-Hillsboro, OR-WA

Salem, OR

Pennsylvania

Allentown-Bethlehem-Easton, PA-NJ

Altoona, PA

Bloomsburg-Berwick, PA

Chambersburg-Waynesboro, PA

East Stroudsburg, PA

Erie, PA

Gettysburg, PA

Harrisburg-Carlisle, PA

Johnstown, PA

Lancaster, PA

Lebanon, PA

Philadelphia-Camden-Wilmington, PA-NJ-DE-MD

Pittsburgh, PA

Reading, PA

Scranton–Wilkes-Barre, PA

State College, PA

Williamsport, PA

York-Hanover, PA

Puerto Rico

Rhode Island

Providence-Warwick, RI-MA

South Carolina


Charleston-North Charleston, SC

Columbia, SC

Florence, SC

Greenville-Anderson, SC

Hilton Head Island-Bluffton, SC

Myrtle Beach-Conway-North Myrtle Beach, SC-NC

Spartanburg, SC
Sumter, SC

South Dakota – No orders


Rapid City, SD

Sioux Falls, SD

Tennessee


Chattanooga, TN-GA

Clarksville, TN-KY

Cleveland, TN

Jackson, TN

Johnson City, TN

Kingsport-Bristol, TN-VA

Knoxville, TN
Memphis, TN-MS-AR

Morristown, TN

Nashville-Davidson–Murfreesboro–Franklin, TN

Texas


Abilene, TX

Amarillo, TX

Austin-Round Rock-Georgetown, TX

Beaumont-Port Arthur, TX

Brownsville-Harlingen, TX

College Station-Bryan, TX

Corpus Christi, TX

Dallas-Fort Worth-Arlington, TX

El Paso, TX

Houston-The Woodlands-Sugar Land, TX
Killeen-Temple, TX

Laredo, TX

Longview, TX

Lubbock, TX

McAllen-Edinburg-Mission, TX

Midland, TX

Odessa, TX

San Angelo, TX

San Antonio-New Braunfels, TX

Sherman-Denison, TX

Texarkana, TX-AR

Tyler, TX

Victoria, TX

Waco, TX

Wichita Falls, TX

Utah


Logan, UT-ID

Ogden-Clearfield, UT

Provo-Orem, UT

Salt Lake City, UT

St. George, UT

Vermont


Burlington-South Burlington, VT

Virginia


Blacksburg-Christiansburg, VA

Charlottesville, VA

Harrisonburg, VA

Lynchburg, VA

Richmond, VA

Roanoke, VA

Staunton, VA

Virginia Beach-Norfolk-Newport News, VA-NC

Winchester, VA-WV

Washington
Release of restrictions varies by county but most impacts will not be seen on the graph by today.

Bellingham, WA

Bremerton-Silverdale-Port Orchard, WA

Kennewick-Richland, WA

Longview, WA

Mount Vernon-Anacortes, WA

Olympia-Lacey-Tumwater, WA
Seattle-Tacoma-Bellevue, WA
Spokane-Spokane Valley, WA

Walla Walla, WA

Wenatchee, WA

Yakima, WA

West Virginia

Beckley, WV
Charleston, WV

Huntington-Ashland, WV-KY-OH

Morgantown, WV

Parkersburg-Vienna, WV

Weirton-Steubenville, WV-OH

Wheeling, WV-OH

Wisconsin


Appleton, WI

Eau Claire, WI

Fond du Lac, WI

Green Bay, WI

Janesville-Beloit, WI

La Crosse-Onalaska, WI-MN

Madison, WI

Milwaukee-Waukesha, WI

Oshkosh-Neenah, WI

Racine, WI

Sheboygan, WI

Wausau-Weston, WI

Wyoming – No orders.


Casper, WY

Cheyenne, WY


Pingback: Hot State Update | IP/EM/Safety