One of the physicians at one of the main hospitals in my metropolitan area wrote a post on Facebook that got my attention. I asked if I could share it here.
From Kacia Lee, MD at HCMC:
MN friends,
We need to talk. I know you’re getting stir crazy with this stay at home order. The weather is lovely, you miss your people, can’t we just have ONE little get-together??? The answer is NO. Here’s why:
I’ve been working in our Viral Screening Clinic for a month, and in the last few days I’ve seen a shift in our patients. Three weeks ago we were seeing primarily the “worried well”; two weeks ago it was travelers; a week ago it was healthcare workers. This week it’s people who are sick **because they weren’t social distancing**: they drove a relative to a city a few hours away; they got together with a friend from out of town; they met up with a coworker a couple times; the whole family was staying at home except dad, he got sick, and now the whole family is sick; etc. ALL of these were avoidable! But SOCIAL DISTANCING ONLY WORKS IF YOU DO IT CONSISTENTLY.
Today was the busiest day we’ve ever had in the viral clinic: 135 patients before I left for the day, with the evening crew ready to take over. I saw 25 patients myself (for reference, a normal “busy” day for me in clinic is 16-18 patients).
I know this is hard. I know we’re now taking steps to “open the economy”. But from what I’m seeing on the “front lines”, all of this talk of reopening is painfully off the mark. WE HAVE NOT FLATTENED THE CURVE; THE NUMBERS ARE GROWING. Please, please, PLEASE — STAY HOME if you can! If not for yourself, for your family and friends; for the people you could unwittingly pass the virus on to. Stay safe. Stay healthy. Take care of each other. We are quite literally all in this together!
Someone tried to make an argument to me today that Sweden wasn’t really having any problems with their very relaxed approach and the US should do the same. I knew that was really bad information so I decided to make a quick comparison of cases and deaths among the Scandinavian countries with two months of data.
Note that the first cases started roughly the same time. The left axis is the number of cases and is the solid lines for each country, the right axis is the number of deaths and is the dotted line for each country. For ease of comparison, each country has their own color for cases/deaths.
Those 50,000 deaths were mostly over the course of FOUR weeks instead of an entire year. I had previously addressed why COVID-19 isn’t comparable to influenza.
A number of states are moving to open up their economies again. Many of these measures puzzle me, especially given that many states haven’t even hit their peaks yet.
There are a number of things that concern me. I’ve seen a lot of people who still deny that this is a problem. I would imagine that they are the ones who are also indicating that they will not wear masks in public to protect others. That’s simply selfish. I would ask them if they would go to a surgeon who refuses to wear a mask while they are operating on them. The principle is the same.
One of the other arguments is that it infringes on their rights. That notion of American individualism could easily be our downfall during a pandemic, and alluded to that earlier. I argue that people have a right to swing their arms around wildly if they like. However, that right comes to an end as soon as they come in contact with me.
The use of masks is the same concept but on a much more mortal scale. I would be much more at ease about lifting a few restrictions if I thought Americans would act out of concern for each other, but it’s pretty apparent that it’s become a very selfish society. That leaves me in fear for the worst.
I’ve been meaning to get to this for some time but given that this blog is simply a side project for me sometimes I don’t have the energy or motivation by the end of the day. I put a lot more effort in before the US got involved in the hopes that I might at least help slow the inevitable. It seems now that people are pretty entrenched in their belief systems and don’t care to much for data. Regardless, I’ll do all 50 states starting with a graph for the entire US and territories. I can easily do this by county as well, but give that there are 3007 counties in the US, I’ll pass.
As you look at these, keep in mind that the case scales will change, but I have kept the case fatality rates fixed for each state as well as the time scales. In the next version I hope to adjust by population which will make a state to state comparison very easy to assess visually.
I haven’t looked at any data in detail lately for a couple of reasons. First, I needed to reach some closure with the death of my father. The funeral was a few days ago and was another surreal experience because of social distancing.
More importantly though, I will admit I was afraid of what I might find in the data. Unfortunately, my instincts were correct. The current case fatality rate (CFR) globally is 6.88% and still appears to be climbing. To provide some context, the estimates for the CFR for the Spanish Flu in 1918 ranged from about 6-8%.
I will add though that I still think this might be high because of our lack of a true understanding of the denominator because of the lack of adequate testing. South Korea gives us a little bit of hope in that regard, where the CFR is currently running at 2.21% However, it’s best to plan for the worst, so I will discuss further under the 6-8% assumption and at 20% attack rate.
The estimated total global mortality in 1918 from Spanish Flu was 50-100 million, although some experts believe that the higher number is more accurate. The estimated global population in 1918 was 1.8 billion. Today it is about 8 billion. Assuming we match 1918 and adjusting for the current global population, that means that we can expect somewhere around 222-444 million deaths worldwide from COVID-19. Even if the CFR is only 2%, that still means about 74-148 million deaths globally. However, it’s important to remember that this is a very different disease. One model of transmission for the Spanish flu estimates the R-naught at 1.36-2.07. It’s also important to note that there is a MUCH longer period of asymptomatic transmission before symptoms begin with COVID-19 than influenza as well as that the R-naught for COVID-19 is currently estimated at 2.2-2.7. That leaves me thinking that we will experience a higher attack rate than 20% with COVID-19.
A number that large is very hard to grasp. To provide some perspective, here’s a table of the estimated populations of the 25 largest countries in the world:
China
1,439,323,776
India
1,380,004,385
United States
331,002,651
Indonesia
273,523,615
Pakistan
220,892,340
Brazil
212,559,417
Nigeria
206,139,589
Bangladesh
164,689,383
Russia
145,934,462
Mexico
128,932,753
Japan
126,476,461
Ethiopia
114,963,588
Philippines
109,581,078
Egypt
102,334,404
Vietnam
97,338,579
DR Congo
89,561,403
Turkey
84,339,067
Iran
83,992,949
Germany
83,783,942
Thailand
69,799,978
United Kingdom
67,886,011
France
65,273,511
Italy
60,461,826
Tanzania
59,734,218
South Africa
59,308,690
I’m going to relate this to the US since that is where I live and where most of the readers of my blog are from. Imagine EVERY PERSON in the US dead. That’s the scale of death that we face on the global scale. As much as I’ve tried to impress on people what is developing, I still don’t think people understand it.
While the data seems to show that we are hitting the top of the curve for incidence, I firmly believe that is ONLY due to the social distancing and stricter measures being taken by governments around the world.
The big risk we are facing right now in the US is complacency. Just because we have a stabilizing incidence, people seem to think that we can go back to things as usual. That’s a major fallacy. Rashly reopening everything will take every state back to a point of needing to start at day one again with social distancing. Governors who are opening their states up quickly are going to be doing so at great peril to their populations.
There’s an even bigger problem though when those types of resets need to happen. Globally, we have been burning through medical supplies, pharmaceuticals, and staff at an alarming rate. Granted, production has increased for many of those items, but we are there are many others where production has not been increased to meet demand.
For example, as we lose healthcare workers, they can’t just be manufactured in the matter of a few weeks. Fewer caregivers means lower capacity for patients in hospitals. That also means that the surge capacity of hospitals drops for subsequent waves, which increases the chances of death from COVID-19 but other causes as well, which become what I’ve referred to earlier as secondary causes of death.
Another secondary cause of death will stem from the shortage of pharmaceuticals. Currently, the main reported shortage is albuterol sulfate, which have been used extensively in the treatment of COVID-19, and is also the active ingredient in inhalers to treat asthma. That means that we could easily start to see secondary deaths among people with asthma who are unable to get inhalers who have a major asthma attack. This is one of the reasons I urge people who need life sustaining medications to try to get a three month supply.
I honestly hope I’m wrong and am accused of being an alarmist. However, I would much rather we act appropriately and not need to than to do nothing and wish we did.
I made a simple graph of countries that simply expresses the raw number of deaths normalizing them all to the day of their first death. I removed any that didn’t have at least 100 deaths and then further thinned out ones that didn’t add any appreciable information. In addition, I removed China because I really think that their data isn’t that good. I suspect there are a lot more deaths and cases than they are publishing. The US is on a collision course with something awful and people still don’t seem to see that.
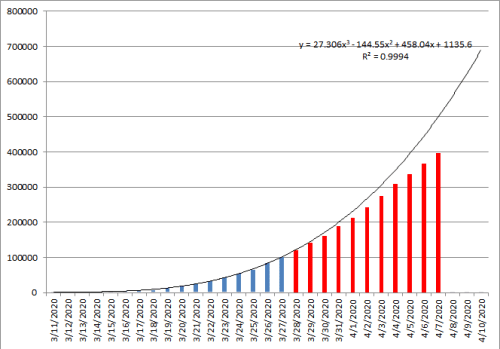
On March 27th, I projected the number of total cases we would see in the US based on the case data that was available at that time. Fortunately, enough people have been doing their part to “flatten the curve.”
The blue bars were the total US cases up to that time and the line represented the case growth curve if nothing changed. The red bars are the actual data that resulted.
Now if we could just convince those not in compliance to do their part.
It’s been a long time since I looked at the COVID-19 data. I had too much going on in my personal life to deal with and needed a break.
I’ve pulled down the entire global data set from Johns Hopkins again and am starting from scratch with graphs. They should look relatively familiar but I’ll explain them again.
The bar graph portion represents the number of new cases (light blue), recoveries (green), and deaths (black). The black line is the moving case fatality rate (CFR) and the red line is the trend of the case fatality rate. As that trend line becomes more horizontal, we will have a good estimate of the CFR. I’ve also made some of the bars partially transparent so the shorter ones can be seen even though they are superimposed on each other.
While looking through these, keep in mind that the scales are going to change for the bar graph portion. Also, these may look a little different from my previous graphs but that has to do with changes that were made in the data set. Just ignore wide swings in the data an pay attention to trends.
I will also be breaking these down by states/provinces except for the US in this post. There must be at least 1000 confirmed cases for inclusion. The US data in this particular data set does not have that resolution. I’ll be working on a US one separately.
Anyone who says that things are improving is grossly mistaken or spinning the facts. One particularly interesting area to watch will be Sweden, which decided not to go any kind of restrictions and let the disease takes its course. I think that will quickly play out to have been a massive mistake.
I’ve been trying to figure out how to express this but words simply escape me. I lost my father a week ago. I think mostly what I want to get across is how hard dealing with death and dying is during a pandemic.
For the last three weeks of his life, we could not see him I understand that from my background in infection control and epidemiology, but at the same time, it was awful not to be able to visit him and support him, just as it was and still is hard not to be in the presence of other family members for mutual support.
For the majority of the time, it was due to bans of visitors both at his assisted living facility but also at the hospital. However, we changed his situation to comfort care and hospice when there had been no improvement. When he was moved to a hospice facility for the final two days, technically we could have gone to see him. However, it simply was not safe for one of my family members to do so and I had been dealing with some upper respiratory symptoms and was worried about what I may be incubating and decided to stay home.
We are still trying to figure out how to have a funeral service. I know it’s going to be really strange with only immediate family present and maybe a few people streaming it from their homes.
I guess what I would like to say is that I know many families all over the world are experiencing similar issues.