Today was the best view of what’s coming in the US since before Thanksgiving. Most of the data should be in from the Thanksgiving weekend now. Unfortunately, the first and second derivatives both suggest that we are about to see the fastest rate of growth in cases since this began late next week. The rapid climb of the positivity rate also supports this.
I doubt that will be readily available in the data though due to home testing and labs becoming backlogged again. This is primarily delta. If omicron is as virulent or if it evades vaccine, we are in for a world of hurt. If either of those are true, we should be treating omicron as an entirely new pandemic superimposed on the current one. Maybe this will finally awaken those who have been in denial, but I have my doubts.
I’ve been watching the data daily as cases begin to surge in many parts of the US. I have indicated that I suspect that the case volumes this winter could be 2-3 times as high as the surge last winter. I detected a new signal today in the data that suggests that my assumptions are correct.
I have been using the first derivative (red line) using the prior three weeks of data to monitor acceleration and deceleration of cases since very early in the pandemic. As I’ve studied it, I’ve also noticed that this derivative slope can forecast reasonably well about 10 days ahead, where you can see it extending further to the right than the epidemic curve below it in blue.
Visually, what concerned me was that the tail seems to be climbing much more steeply than in the past. I am disregarding the very middle of the graph since all of the up and down noise is mostly due to lack of reporting of data during the holiday weekends.
When zooming in, it is even easier to see just how sharp the climb is with that line.
That led me to look at the second derivative to see if that rate of change was really increasing faster than in the past using the past week of values from the first derivative.
In the graph below, the red line is the same as above (the first derivative), but on a slightly vertically compressed scale. The dotted black line is the second derivative, which can be thought of as the rate of change of the rate of change.
Again, ignoring the holiday noise in the middle, the outlook for the second derivative shows it exceeding any prior time in the past sometime over the Thanksgiving holiday weekend, as indicated by the horizontal yellow line.
I’m expecting case counts to get into the upper 200,000s sometime over that weekend. Unfortunately, we won’t even know that until the middle of the following week for a number of reasons: people are less likely to get tested while traveling, testing sites are less likely to be open, testing capacity will be stretched after the weekend, more at home tests are being used that don’t get reported, and reporting will lag because of the weekend.
I will throw out one last appeal to reconsider travel, especially on any kind of mass transit, over the holiday. Avoid contact with anyone outside of your immediate household. For many people that don’t heed this, it will be the last Thanksgiving they share with some of their loved ones.
STAY HOME
I will update the two primary graphs shown daily until sometime after Thanksgiving, but leave the ones above in place as a point of comparison.
11/21 Note that both the first and second derivatives are turning downward. Don’t be deceived by that. It’s an artifact from cases not being reported over the weekend in many jurisdictions. It will look that way most Sundays and Mondays. That will likely also be the case Thu-Mon of Thanksgiving weekend.
The second derivative is much more sensitive to these changes by design. It’s only using the past week of data, while the first derivative is using three weeks. That was done to look for longer trends in the first derivative while the second one helps identify real changes that are occurring aside from the expected reporting variances.
11/23 As expected, the brief downward trend over the weekend for both derivatives has ended. Tomorrow should provide the best data set to get the clearest picture for another week, but even this is hampered by unreported at home tests and the 1-2 day turnaround for the two major send out labs in the US.
11/24 The virus is proving that it does what it’s going to do and with some variation. There are a lot of variables that eventually become a part of case counts so changes in trajectory are expected.
We will have a good data set tomorrow, but after that we are going to be in somewhat of a data blackout similar the Apollo missions going behind the moon. We have a guess as to where it’s going, but not enough data coming in to know with much certainty. That will be a problem until the middle of next week.
11/26 As expected, the holiday weekend is making it appear that the situation is improving. Other evidence paints a different picture, such as hospitals cancelling elective surgeries, shortages of pharmaceutical and medical supplies, and some hospitals implementing crisis standards of care.
11/30 A little data from the holidays is starting to trickle in. It won’t be readily visible on the graph for a few more days because of how they are designed. The first derivative is smoothed using the data for the past seven days, so it’s still under the influence of the holidays. Currently, the slope that is projected for 10 days out as a point estimate is 582. That coming change is more apparent as the 2nd derivative is approaching zero. I also still suspect that these numbers are underreported due to more home testing as people had been preparing for the holiday weekend.
12/2 Now that we are getting closer to having caught up on the data lost over the holiday, the country is back on track with where I had seen it going. It was bad enough with delta. We are superimposing another pandemic ON TOP of delta with the arrival of omicron. I’ve indicated the data gap in the slop line with a double-ended arrow. Realistically, that entire last part should be slid up so there was no downward dip. The second derivative suggests that the country is heading into the second fastest rate of rate increase we have seen so far.
The nation is speeding toward a cliff without brakes.
I’ve added data for each state (except Nevada and New Mexico – accidental oversight in a data table that will be updated) on mask use compared to cases over time. Look under Graphs at the top of the page or on the menu button for a list of states. Each state has a number of graphs of data. As of this writing, that graph is at the bottom.
It’s clear that mask use dropped precipitously in every state as a result of that change and in many, never recovered to the prior downward curve, likely due to pandemic fatigue, that it has previously been following. It’s also pretty apparent how beneficial that they have been in suppressing case numbers.
The next few months are looking to be much worse than last year. It’s not too late to protect yourselves and those around you.
If you haven’t been vaccinated, get started. If you are due for a booster, get one.
If you haven’t been wearing a mask, ALWAYS wear them in indoor public spaces. If you are going to be in a crowd outside, wear one as well.
Don’t travel unless absolutely necessary. People want to see their families. I get that. The bigger question though might be “Do you want this holiday to be for the last time?”
I’ve commented in some of my posts here, on Facebook, and Twitter that we should be treating SARS-CoV-2 as a virus that is spread through both the airborne and droplet route and provided some primary literature to support that assessment. The distinction between the two has been treated as an almost binary relationship when in fact, they occur along a continuum. A number of different factors, both related to the person who is spreading it, but also to the local environment, determine which might be the more dominant form of spread in that area. These can be things such as viral load, point of infection, activity of the person who is infected, air changes per hour, humidity, etc. This should not be considered a completely list, but just a representative one. In addition, I have previously commented that we should not have eased up on the recommendations for mask use.
“PSA: DO NOT TAKE YOUR MASK OFF INDOORS, even if there is no one else around.
The virus persists in the air for HOURS because #CovidIsAirborne Only take your mask off outdoors, and preferably use an N95 mask.
Aerosols that carry the virus can float in the air for HOURS. Long after an infected person has left the room, the air is still not safe to breathe, unless there is aggressive ventilation and filtration to keep it safe. Just because you are alone does not mean you are safe.
Do not take your mask off inside, even if you are alone. It’s not safe for you. And if you are infected, you will be making the air unsafe for others. Read on to understand this more fully.
Aerosols are tiny droplets produced in your respiratory tract during breathing, speaking, etc. Viruses attach to them, and this is how COVID is spread The virus is not free-floating in the air, so all the anti-maskers who say masks *can’t* work don’t understand the science. 4/n
The ones produced by breathing are the smallest. Small aerosols are most likely to persist in the environment and most likely to make it to the smallest of another person’s airways. Quiet breathing produces smaller amounts than other expiratory activities.
Talking produces a lot more aerosols that are larger, as well as droplets. These can quickly evaporate down to small aerosols in dry air. Masks help to contain the large aerosols and prevent this. Small aerosols are really bad because they can penetrate the lungs deeply.
If virus makes it to the smallest of your airways, it is more likely to cause severe disease. Virus that lands in your nasal passages is less likely to cause severe disease, and it will take more virus there to get you sick.
1/ COVID-19 has "anisotropic" infection:
Despite 100 times LOWER dose, monkeys infected by SARS-CoV-2 thru aerosols developed MORE SEVERE respiratory disease and lung pathology (vs. nose/trachea)
What about taking my mask off in my personal office space? You might ask Don’t do it unless you know that the air in your office is not recirculated with air from other parts of the building. Recirculated air is chock full of other people’s aerosols.
How do you know that? Ideally talk with the building engineer. High ventilation can make a big difference by diluting out the aerosols with fresh air. (WHO recommends a ventilation rate of 10 liters per second per person). CO2 detectors can help.
📍NOTA BENE—Don’t be deceived if you see nobody in a room. CO2 levels can still be high if room is poorly ventilated. Remember #SARSCoV2 aerosols can stay airborne from 20 min-16 hours in stagnant air. CO2 is the easiest metric to tell you it’s stagnant. #COVIDisAirborne#COVID19https://t.co/GmYmmMfRbP
Aerosols can easily spread through air ducts. SARS spread via the air ducts and defective sewage traps, leading to a large outbreak in an apartment building in Hong Kong. Buildings need to be designed better for better health and future pandemics.
Now for toilet plumes. Lidless toilets in public bathrooms contaminate the air and all surfaces with feces and virus. We need serious mitigation here. So for God’s sake, DO NOT EVER TAKE YOUR MASK OFF IN THE BATHROOM.
5) Yes, toilet plumes are real…
Flushing the Toilet May Fling Coronavirus Aerosols All Over
A new study shows how turbulence from a toilet bowl can create large plume that is potentially infectious to a bathroom’s next visitor.https://t.co/I1xgzhnjtx
Recirculated air is an aerosol orge, where everyone’s lungs are bathing in everyone else’s aerosols. Practice safe breathing in the time of COVID. Avoid pulmonary promiscuity. Don’t let other people’s aerosols into your lungs, unless they are in your bubble.
Special message to educators: Do not take off your mask to eat lunch in your classroom! Do not take your mask off before or after class And most of all, do not take your mask off to speak This is for your safety, and the safety of your students.
Don't remove your mask to talk. This is the most important time to wear it! You release a lot more respiratory droplets and aerosols when talking than when just breathing. This school outbreak was caused by unvaxxed teacher who "read aloud unmasked." Had symptoms.🤦♀️ https://t.co/trpmZUYOj9
Eat lunch outside or in your car. Avoid being downwind of other people. Maintain at least 6’ distance outside. Do not eat inside. It is too hard to know if the inside air is truly safe. We need to break the chain of transmission.
Many figures are from this review article on the airborne spread of disease. This should be required reading for all people in public health, infectious disease, hospital infection control, school superintendents, architects, and HVAC engineers.”
I would also like to add that should we come up against supply chain shortages and face a respirator shortage, I am one of the coauthors to guidelines on respirator reuse. These may become helpful at some point.
Think of vaccines and various non-pharmaceutical interventions as surge protectors that protect healthcare as well as economic and political stability. Unfortunately, many Americans seem to disregard these measures and overload the system, putting all of us at risk.
People have asked me why I think October will see another climb in cases. The main reasons are due to the final pushes toward summer travel (especially Labor Day weekend) and the opening of schools. In addition, as fall settles in, people tend to be indoors together much more. Lower humidity will also drive more airborne spread as opposed to droplet spread of the virus. The big piece though is that a number of people seem to live under the false notion that this is done.
I had to go into a big box hardware store this week. I generally have done everything curbside but needed a key made. I had my N95 mask on when I went in, but was dismayed at how few people were wearing masks or just had them on around their necks (employees). I’ve heard similar stories about the behavior of the public from others I know. That behavior will contribute as well, whether it’s due to the discounting of the reality of the pandemic or pandemic fatigue among those who do understand the facts.
While some may think that we should be in much better shape this year compared to last year, I don’t think that is the case at all. While vaccines certainly help reduce the spread and severity, we simply do not have enough people vaccinated in this country to make that effect work for the population as a whole.
The other piece is that we were dealing with alpha last year, this year we are dealing with delta, which has a much higher transmission rate.
I think a year over year comparison is worth making, since many of the societal forces that drive transmission show up in these numbers.
First, look at cases each year. There is some concordance between the peaks. It’s a bit harder to know if there are similar factors driving the ones in early spring since that is when SARS-CoV-2 first emerged in the US. That is why I’m relying on my rationale I’ve already described.
The other thing I’ve puzzled over is the cause of the delay during the summer this year. I’m beginning to think that is a result of an incomplete sample of cases in many states. Some simply aren’t testing children as much as they had last year. That’s a complete disservice to the public because it delays the implementation of public health interventions, much in the same way that Florida only provides data once per week. That’s part of the reason why I waited to write this today instead of earlier this week. It wouldn’t have painted a very accurate picture with an entire state excluded.
There are a couple of other important things to note when comparing cases year to year. First, look at how the peaks more than doubled that of last year and that the baseline valleys are much higher. Those baselines are very important when it comes to exponential spread of a disease. That’s a big part of why influenza was so minimal last year. High influenza vaccination rates combined with mask use and other non-pharmaceutical interventions prevented influenza from gaining a foothold.
It’s also important to think about positivity rates in relation to cases every time that cases are assessed. It helps answer the question of whether the prevalence in a community is truly rising or falling or if it is just an artifact of more or less testing. This data is easy to find for every state from Johns Hopkins.
You can see in both graphs that the recent rate of the downward trend in case number and positivity is slowing. That is part of the reason that I have used a three-week slope to assess the rate of change in case increases or decreases. Oddly enough, this graph had the current slope well below zero until I added the last two days of data. Now, the slope is just hitting the X-axis at zero, indicating either we are reaching a flat plateau, or in my opinion, we will see cases climbing very obviously again in the next week or so. If I’m right, especially if case numbers more than double that of last year, we are in for a world of hurt. Much of the country will need to implement crisis standards of care. This is what I’ve really wanted to avoid and why I labored so hard writing and sharing across platforms.
The interest rate on our actions is insanely high and our next payment is coming due. I think it’s going to bankrupt us in a number of ways.
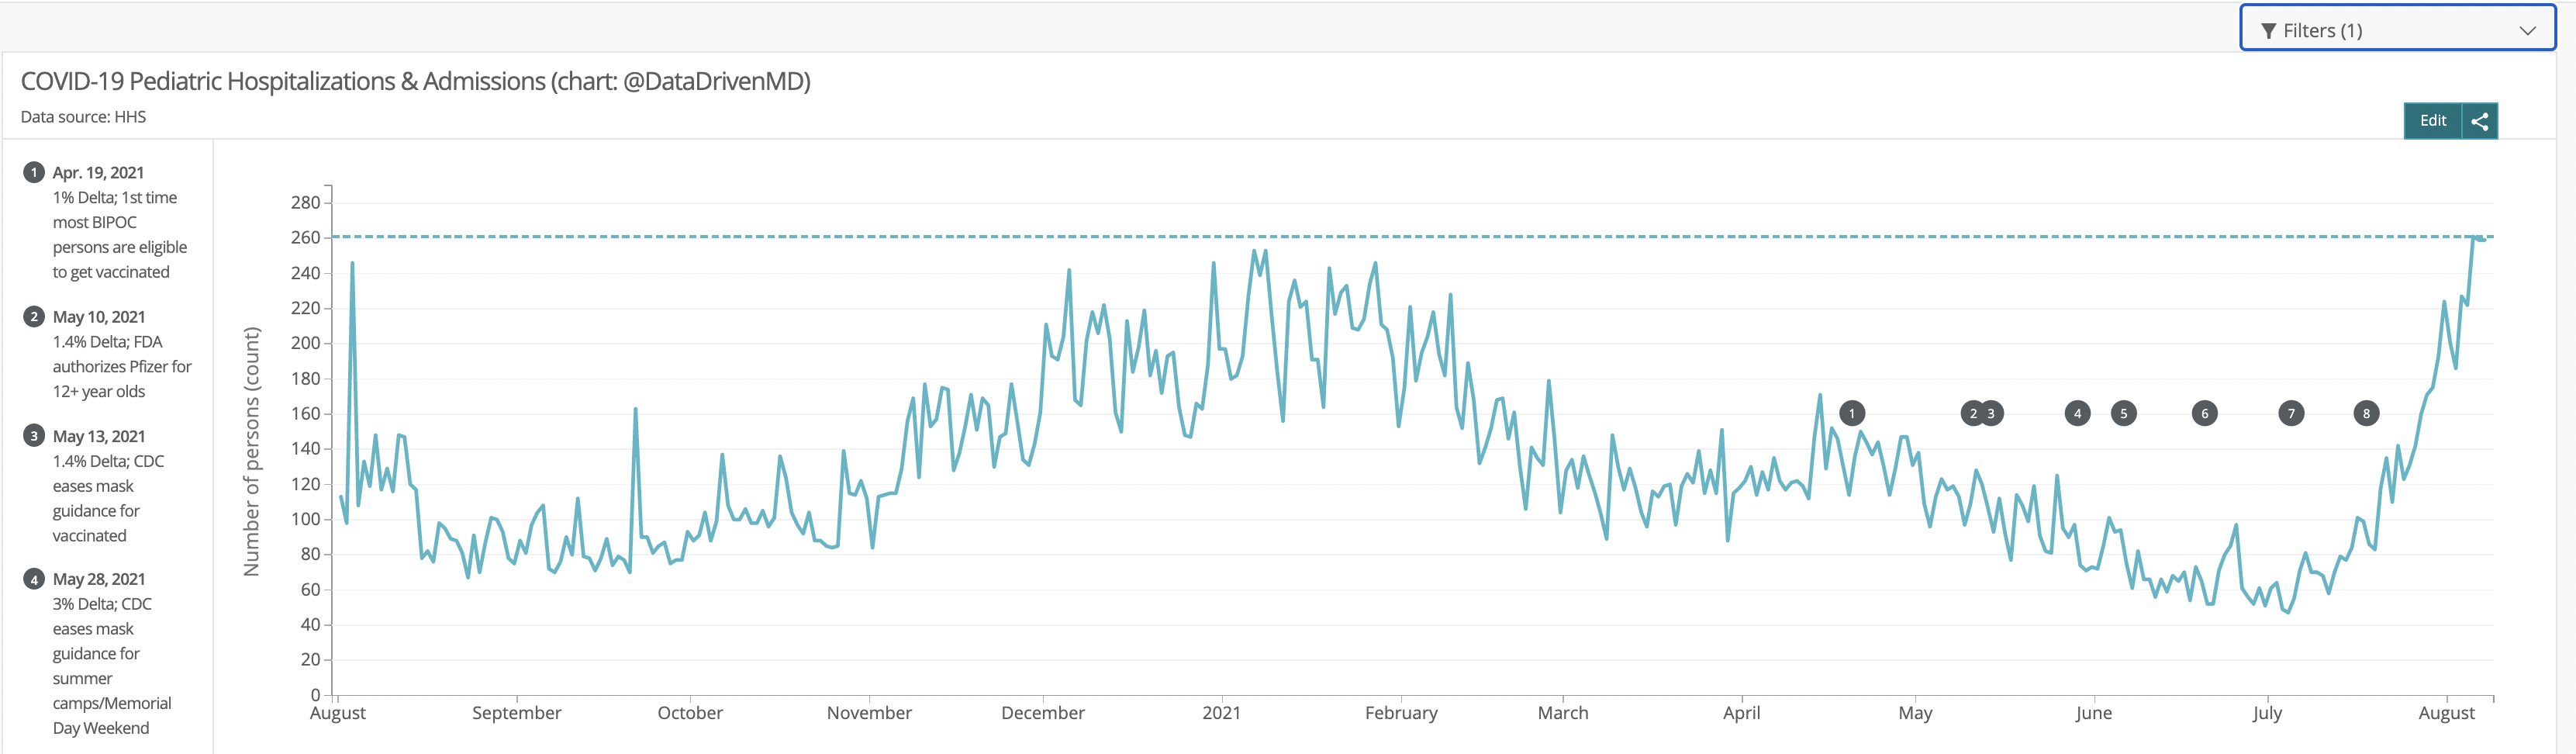
I am simply shocked that schools are opening. Children under 12 haven’t been vaccinated and not many have that are older. Delta is readily spread via the airborne route and this not only will make this wave considerably worse, but could very well badly impact the health of many more of these children than we realize given the way that the virus damaged tissue and organs, often in ways not immediately detected. My fear is an epidemic of diabetes, heart, liver, and lung disease, neurological problems, and many others. There are numerous examples to support that, but I’m going to sum it up from one Tweet that fits the data I’ve pulled on pediatric hospitalizations.
Here’s what I would do:
If my child was under 12, I would pursue virtual schooling.
If my child was not vaccinated, I would pursue virtual schooling.
If my child had any comorbidities, I would pursue virtual schooling.
If anyone in my household wasn’t vaccinated or had comorbidities, I would pursue virtual schooling.
If my school district didn’t have mandatory masking, I would pursue virtual schooling.
If my school district didn’t require vaccination for those eligible aside from legitimate contraindications, I would pursue virtual schooling.
If I had the slightest hesitation about my child’s safety on a bus or in the school, I would pursue virtual schooling.
2020 election outcome data for the presidential race was used to group voters by county into six strata:
80-100% Republican
60-80% Republican
50-60% Republican
50-60% Democrat
60-80% Democrat
80-100% Democrat
Each of these strata were pooled for both 2010 population per the US Census Bureau and the incidence of COVID Cases. Due to the geographical election structure not aligning with county structure in Alaska, Alaska was excluded from this analysis.
The pooled COVID cases for each strata were then calculated as an incidence rate per 100,000 per calendar day. A 7-day moving average was then applied to each strata to remove some of the normal weekday variations and each line on the graph was colored to represent the degree of dominance of a political party (dark red represents >80% Republican, dark blue represents >80% Democrat) by 2020 presidential vote.
The hypothesis was that the more strongly a county voted Republican, the more likely it was to listen to and be influenced by misinformation and disinformation channels.
Results
There is a clear gradient in case rates depending on the political leanings of counties. This has remained consistent over time with two exceptions.
When the pandemic first started, a large proportion of the spread was in New York City. This was before there was a good understanding of the mode of transmission and in a very dense population area. As the virus spread into less populous area of the country and more knowledge was gained about transmission, other factors became more important in spread, such as messaging and beliefs.
The other anomaly in this pattern is in the spring of this year. This could be an effect of college students traveling during spring break, who are at an age where they are eager to return to normal and more likely to be a source of asymptomatic community transmission.
For better clarity in just how big the differences are in the extremes, the next graph only shows the >80% wins in the election. Except during the rapid case declines that were due to the vaccination efforts that reduced spread and the previously noted exceptions, the rates of new cases in strongly republican counties were almost four times as high as those in strongly democratic.
Discussion
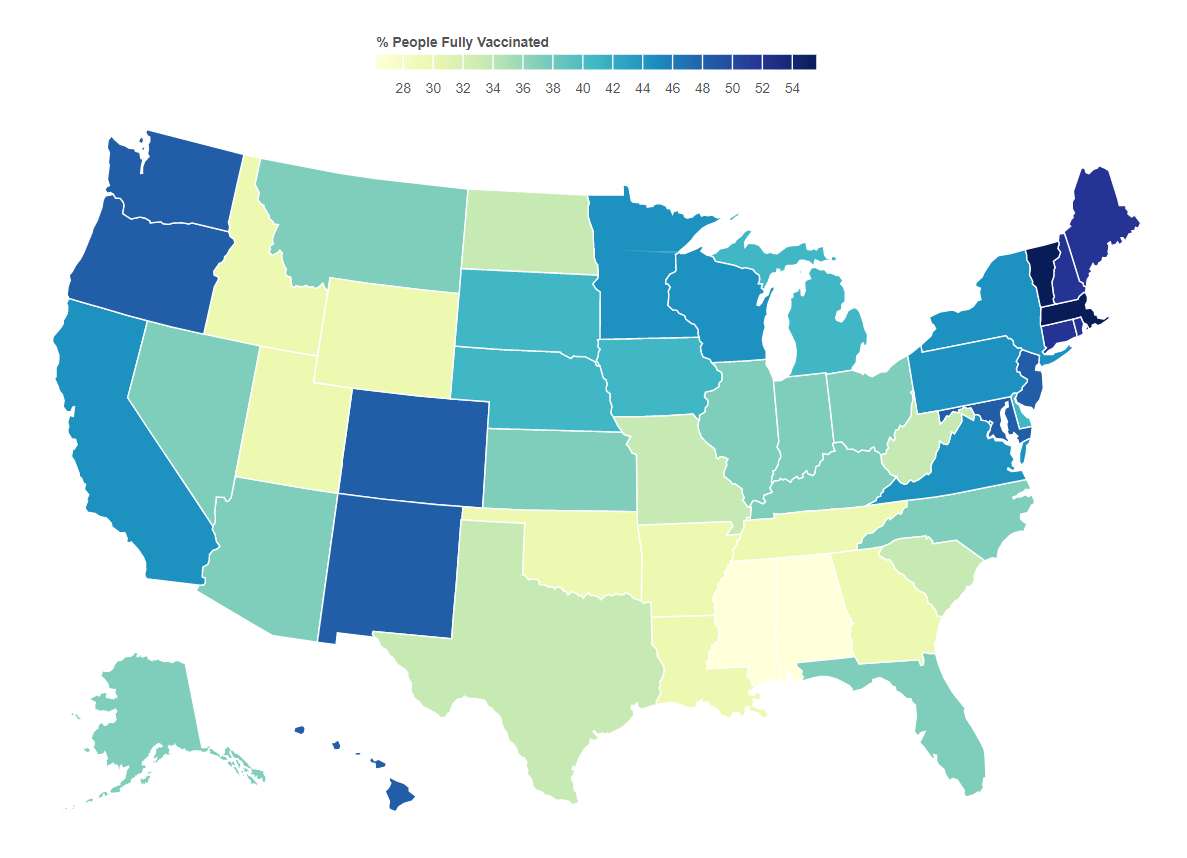
This becomes much more important as it related to vaccination efforts. As of this writing, the vaccination rates by state correlate well with voting. A current view of this map can be found here.
The majority of lies and disinformation seems to spread mostly in right wing media and is instigated by twelve different people. This is causing irreparable harm to health and to the economy. Sadly, as new variants come to dominate cases, the spread will be most obvious among those who have been fooled by these sources. What remains to be seen is whether the media will be held responsible for the damage they have caused.
Do your part. Get vaccinated. Encourage others to do so. As B.1.617.2 (the delta variant) gains a foothold, your health and life may depend on it.
An Epilogue
There is a similar pattern for deaths when stratified the same way, which is not surprising at all. The two big jumps for about a month in May 2020 are due to states catching up on death reports and submitting them all at once.
8/21/21 Addendum. Fox “News” carries some responsibility for what is happening by allowing lies like this.
12/4/21 The rapid drop in the 80%+ Republican counties the past few weeks has been puzzling. The data hasn’t been tracking with that of the other strata. One possible explanation might have something to do with those who move south for the winter. However, the data this week painted a darker picture. While it may be easy to skew case data by not reporting it, it’s much harder to do so with death data. While this certainly doesn’t draw any specific conclusions, it certainly supports evidence that some governors have been trying to hide the impact in their states.
12/9/21 It appears that data from a very red state has been suppressed for about a month.