
It’s been awhile since the data for different has been graphed here. Part of that has to do with the events in the US the past two weeks.
Note: I’m still working on how best to get the graphs loaded to look correct.. While they might look bad in this page, if you right click and open the image in a new tab or window, it should be large enough to view in detail. I’m all ears if any readers have an idea of how to do this without creating a lot of extra work on my end.
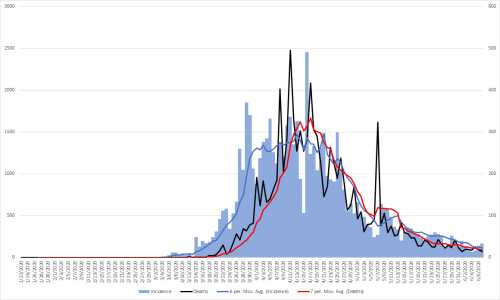
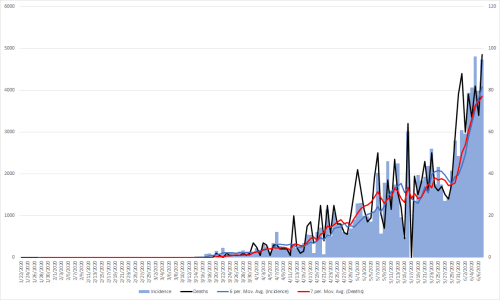
The light blue bars are new cases each day, measured on the left y-axis, the black line is deaths measured on the right y-axis.
The blue line is the 7-day moving average of cases, the red line is the 7-day moving average of deaths. Remember that the scales are different between graphs, so do not make the mistake of comparing them directly.
Countries that seem to be doing an outstanding job will be highlighted. It would be worth learning what their control strategies were that made them successful.
One interesting thing in both the raw cases and deaths is the seven day cycle of peaks and valleys. That could either be due to less reporting on the weekends or perhaps the natural cycles of the disease. It should also be noted that the deaths lag about a week behind identified cases, or at least that was the pattern in the US.
I am only including countries that have had at least 10,000 reported cases. If anyone has an interest in any other particular countries not included here, send a message and I will generate them for all of the ones requested next weekend.
Global – One interesting point of note for this is that the deaths and new cases diverge about mid-April. My guess is that this has to do with much more testing being done.

Afghanistan

Algeria

Argentina

Armenia

Australia

Austria

Bahrain

Bangladesh

Belarus

Belgium
Bolivia

Brazil – It should be noted that reported data from Brazil could become inaccurate.

Canada

Chile

China – Data from China has been questioned as well. The spikes in cases and deaths seem to support that notion.

Colombia

Denmark

Dominican Republic

Ecuador – Difficult to interpret because of reporting spikes.

Egypt

France

Germany

India

Indonesia

Iran

Iraq

Ireland

Israel

Italy

Japan

Kazakhstan

Korea, South – This is a particularly good warning. Things appeared to be under control and now cases are climbing again. There is some data available on their NPI approach.

Kuwait

Mexico

Netherlands

Nigeria

Oman

Pakistan
Panama

Peru

Philippines

Poland

Portugal

Qatar

Romania

Russia

Saudi Arabia

Serbia

Singapore

South Africa

Spain

Sweden

Switzerland

Turkey

Ukraine

United Arab Emirates

United Kingdom

US

