Monthly Archives: July 2020

Back to School

back to school

There is currently a big push from the federal government to open schools this fall. Is this the right move for the country?

There are seven different known types of coronavirus in the world.

Common human coronaviruses

  • 229E (alpha coronavirus)
  • NL63 (alpha coronavirus)
  • OC43 (beta coronavirus)
  • HKU1 (beta coronavirus)

Other human coronaviruses

The four common ones (229E, NL63, OC43, and HKU1) generally cause symptoms related to the common cold, although they can get into the lower respiratory tract and cause pneumonia. Most people get infected by one or more of these over the course of their lifetime. These viruses are responsible for about 15% of colds. Most children will have at least 6 to 8 colds a year. Children who attend daycare will have more.

Causes of the transmission of colds

According the the University of Rochester Medical Center, there a four main factors that place children at risk for the common cold.

  • Less resistance. A child’s immune system is not as strong as an adult’s when it comes to fighting cold germs.
  • Winter season. Most respiratory illnesses happen in fall and winter, when children are indoors and around more germs. The humidity also drops during this season. This makes the passages in the nose drier and at greater risk for infection.
  • School or daycare. Colds spread easily when children are in close contact.
  • Hand-to-mouth contact. Children are likely to touch their eyes, nose, or mouth without washing their hands. This is the most common way germs are spread.

Think about this in relation to COVID-19. EVERY ONE of these factors also places children at risk of infection with COVID-19 in a school setting.

This is not just limited to elementary age children. For example, this summer, a high school age team of baseball players led to an outbreak of at least 39 COVID-19 cases in their community, seven of which were team members and one was the coach. The Yamhill County Health and Human Services director stated, “It is suspected that the initial case was contracted when some of the players traveled out of state for a game. This spread further when the team traveled together on a team bus. After this point, several players attended multiple social gatherings prior to knowing they were exposed, which spread COVID-19 beyond the individuals on the baseball team.”
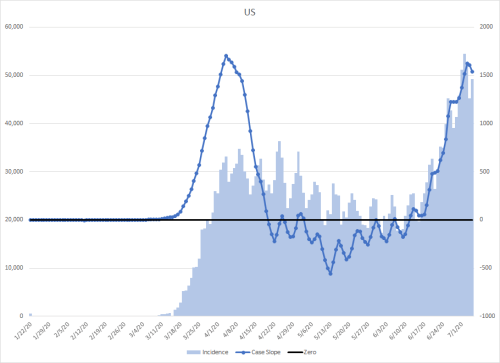
The Data

The Imperial College of London has modeled outcomes of disease by age group. The table below mapped that data to US Census Bureau data to calculate hospitalization and death outcomes. Unfortunately, there was not enough data at the time of publication to estimate the risks to children under 10 years of age.

Assuming that opening schools would spread COVID-19 to just 5% of the population, the impact numbers are pretty staggering, but this is just a model.

AgeHospitalizationsICU AdmissionsDeaths
10-196,491325130
20-2925,9161,2961,728
30-3965,0103,2501,625
40-49130,0658,1943,307
50-59216,37426,39812,728
60-69246,06767,42232,611
70-79204,52088,35342,924
80+155,151110,00252,854
TOTAL1,049,594305,240147,906

The outcomes are far worse when using published data. A large data set of 73,214 patient records from the China CDC was mapped to US Census Bureau data. In this data, hospitalization was only broken down into mild, severe, and critical, but not by age, so only totals are provided. I’m assuming that mild means recovery at home, severe means hospitalization, and critical means ICU care.

Mild: 10,993,990
Severe: 1,900,196
Critical: 678,641

The study did break down deaths by age category though

AgeDeaths
10-194,327
20-294,319
30-394,063
40-498,818
50-5927,577
60-6953,364
70-7967,332
80+84,111
Total253,911

Of course, this is assuming that the disease ONLY spreads evenly within 5% of the population. We know that large spread leads to exponential spread. Given that 70% of the population must be immune for herd immunity and that we don’t know if there is long-term immunity after illness, this is a VERY conservative estimate of the outcome of opening schools.

The science should not stand in the way of this,” according to the administration. However, the American Academy of Pediatrics, the American Federation of Teachers, the National Education Association, and the School Superintendents Association don’t agree.

“Educators and pediatricians share the goal of children returning safely to school this fall. Our organizations are committed to doing everything we can so that all students have the opportunity to safely resume in-person learning.

We recognize that children learn best when physically present in the classroom. But children get much more than academics at school. They also learn social and emotional skills at school, get healthy meals and exercise, mental health support and other services that cannot be easily replicated online. Schools also play a critical role in addressing racial and social inequity. Our nation’s response to COVID-19 has laid bare inequities and consequences for children that must be addressed. This pandemic is especially hard on families who rely on school lunches, have children with disabilities, or lack access to Internet or health care.

Returning to school is important for the healthy development and well-being of children, but we must pursue re-opening in a way that is safe for all students, teachers and staff. Science should drive decision-making on safely reopening schools. Public health agencies must make recommendations based on evidence, not politics. We should leave it to health experts to tell us when the time is best to open up school buildings, and listen to educators and administrators to shape how we do it.

Local school leaders, public health experts, educators and parents must be at the center of decisions about how and when to reopen schools, taking into account the spread of COVID-19 in their communities and the capacities of school districts to adapt safety protocols to make in-person learning safe and feasible. For instance, schools in areas with high levels of COVID-19 community spread should not be compelled to reopen against the judgment of local experts A one-size-fits-all approach is not appropriate for return to school decisions.

Reopening schools in a way that maximizes safety, learning, and the well-being of children, teachers, and staff will clearly require substantial new investments in our schools and campuses. We call on Congress and the administration to provide the federal resources needed to ensure that inadequate funding does not stand in the way of safely educating and caring for children in our schools. Withholding funding from schools that do not open in person fulltime would be a misguided approach, putting already financially strapped schools in an impossible position that would threaten the health of students and teachers.

The pandemic has reminded so many what we have long understood: that educators are invaluable in children’s lives and that attending school in person offers children a wide array of health and educational benefits. For our country to truly value children, elected leaders must come together to appropriately support schools in safely returning students to the classroom and reopening schools.”

2nd Stage

Right-click to view graphs full size.

An analogy of a rocket launch is appropriate. The accelerations of the first stage of a rocket is relatively slow as it needs to break free from the bonds of gravity. The second stage already has plenty of momentum behind it and acceleration is considerably easier with the effect of gravity further behind.

The same thing is happening with COVID-19 in the US. When starting with very few cases, it’s easier to keep hospitals from getting overwhelmed. Now that we have started this next surge with a baseline of over 2000 cases/day, it will accelerate considerably faster. This will put most of the healthcare system in the country in overload in the next few weeks, leading to very difficult decisions about who will receive care and who will die. That’s not just for people who have COVID-19 either, it will be a challenge for anyone needing a hospital bed.

Each state has two graphs. The first has vertical light blue bars. They are known as an epidemic curve and each bar is simply the number of cases (known as “incidence”) on a given day. They are measured against the scale to the left.Some of these bars are colored. These are all three weeks after the actual event, because that is the average amount of time to see the impact of one of these changes.Green: The date that a major social restriction was put in place.Red: The date that a major social restriction was relaxed.Yellow: These represent different events that bring people close together. Currently, from left to right: St. Patrick’s Day, Easter weekend, and Memorial Day weekend.

The orange line is the seven-day moving average.The blue line is a derivative function. It helps measure the rate of change in cases. It uses the scale on the left. There is a gray line at zero. When this line is above zero, cases are increasing, when below, decreasing. The distance from the zero line is directly proportional to the rate of increase or decrease.

There are small yellow dots every seven days. There is a seven-day cycle in cases that is relatively easy to spot. These yellow dots occur at the normal peaks.There is another wave that is much harder to distinguish and lengthens each cycle.

The large green dots represent where there is a trough and cases will be pulled lower for a few days on either side, the red dots are peaks and have the same kind of effect. You can sometimes see this effect on the orange line, but you have to keep in mind that other cycles and events are influencing cases at the same time.

The curving red line is a seven-day moving average of the blue slope line with the dots.

Finally, you can see the blue and red lines extending to the right. This is a ten-day forecast.

The second graph with the gray background is an epidemic curve of deaths, again measured on the left axis. This has the same general features as the cases graph.

The orange line is the seven-day moving average of deaths.

The black line is the slope derivative like the blue one in cases. The red line is the seven-day moving average of that line.

This graph also has a ten-day forecast.

The data set is pulled from Johns Hopkins University. If you would like to validate that, you can go to their website, click on “US” in the left column, go to the bottom right corner of the screen and click on “Daily Cases.” That will turn the orange graph into an epidemic curve and you will see it matches mine perfectly. If you want to expand it, go to the top right corner of the graph window and a tool will pop up. You’ll only be able to do this from the desktop site, not the mobile one.

https://coronavirus.jhu.edu/map.html

One particularly important thing to note in the case graphs is that the green dots are the trough of a wave and will make it look like things are heading downward because of the strength of that wave in some states. That influences the derivative that is used, so assume that downward looking trends are only an artifact of that trough and it will change in a few days.

STAY HOME

A Tale of Three Countries

I was sent a link to this video and decided to look at the countries mentioned to see what I could find in the data. I normally wouldn’t link to a video but it makes a strong point. It was very revealing.

Vietnam

Here’s what can be found on the US State Department website at the time of this writing:

* According to the Vietnamese Ministry of Health, Vietnam has had 355 confirmed cases of COVID-19 within its borders since the virus first became known.

  • 336 people have recovered and were released from the hospital.
  • 19 cases are being isolated for treatment.

It has been 77 days without any cases of community transmission in Vietnam; the most recent 88 confirmed cases are all people who arrived in Vietnam with COVID-19 and (like all arrivals) were sent immediately to centralized quarantine.  For further details please see the Vietnamese Ministry of Health website here.

* All people in Vietnam are encouraged to wear face masks and avoid close contact with others in public places if possible.  All travelers on domestic and international flights must wear face masks during the flight and while at the airport.

KPMG stated on March 20th “the Vietnamese government is currently implementing multiple measures, including travel restrictions, compulsory medical declaration, medical checks, and quarantine upon arrival, with immediate effect. In addition to this, the government is limiting approval for new foreign workers to travel to and work in Vietnam in an effort to reduce external transmission of COVID-19 to Vietnam.”

India

These are some of the measures taken in India according to the US Embassy:

  • Prime Minister Modi announced a public curfew on March 22 from 7:00 am to 9:00 pm. On May 1, the curfew was extended until May 18.  For the complete guidelines on restrictions, visit the Ministry of Home Affairs webpage, and consult “Guidelines.”
  • Following a high level meeting of Indian ministers on March 16, the government proposed extensive social distancing measures, including closure of all schools, museums, and cultural and social centers;prohibiting gatherings of more than 50 people; and calling on the public to avoid all non-essential travel. The complete list of measures can be found here.
  • On March 16, 2020 the Government of India expanded compulsory quarantine for passengers coming from or transiting through UAE, Qatar, Oman, and Kuwait. Fourteen-day mandatory quarantine also applies to passengers from China, Italy, Iran, Republic of Korea, France, Spain, and Germany.
  • On March 16, 2020 the Government of India prohibited the entry of passengers from the European Union, the European Free Trade Association (Iceland, Liechtenstein, Norway and Switzerland), Turkey, and the UK. On March 17, the government also prohibited the entry of passengers from Afghanistan, Philippines, and Malaysia.
  • In addition to the restrictions put in place by the central government, on March 16, Maharashtra Chief Minister Uddhav Thackeray announced mandatory quarantine for travelers from the United States, Dubai, and Saudi Arabia. Other states have announced disparate restrictions as well, including the prohibition of entry of foreigners.

There is much more to the story in India though. According to the Brookings Institution, “After a 14-hour ‘Janata Curfew’ test run, India went into full lockdown on March 24; at the time, India had just 500 confirmed COVID-19 cases and fewer than 10 deaths. The sudden lockdown had a severe impact on millions of low-income migrant workers and daily-wage earners. With no savings and little guidance or financial help from the government, these workers and their families faced food insecurity and hardships that led many to walk hundreds of miles to reach their villages.” This action clearly had the unintended consequences of spreading the disease across the country, which has turned into massive exponential growth in cases.

However, there is something to be learned from the data. I had noticed an almost vertical change in the slope of the epidemic curve one day. I’ve changed the scale of the graph to make it stand out and made that particular part of the graph of the derivative slopes red and the three surround areas on either side orange.

What I wanted to know was what had set off this huge leap on May 1st (indicated by the large red dot)? I’ve written earlier how social changes that impact a representative sample of a population take three to show up in the data. Given that information, I could look backward three weeks from May 1st and figure out what happened on whatever day that fell on.

The day three weeks prior to May 1st was April 10th. That didn’t mean anything to me at first and my first idea was to do a search on holidays in India. I was obviously shocked a the result. April 10th was Good Friday. Only 2.3% of the Indian population is Christian. I was puzzled at how such a small percentage of the population could have such a big impact, so I did a simple search using “Good Friday India.”

The first result from that search answered the question.

“Many Christians in India attend special church services or pray on Good Friday. Some people also fast or abstain from meat on this day. Many Christians hold parades or open air plays to portray the last days and hours of Jesus’ life in some areas of India…

…Large prayer meetings and parades may cause local disruption to traffic. This is particularly true in areas with a large Christian population.”

It would be interesting to correlate geographical religious concentrations to increasing cases. Finding this relationship between the data and a social practice is one of the things that makes epidemiology so fascinating to me.

Taiwan

I added the points of emphasis in the quoted section below.

“Lost in the fractious and frankly broken conversation about reopening the economy is a simple truism: containing the virus is the best fiscal stimulus. The U.S. Congressional Budget Office is projecting double-digit contractions in the gross domestic product for 2020 and unemployment rates going up to 16% this year — the highest they have been since the Great Depression. By comparison, Taiwan’s central bank expects growth to slow to about 1.5% for the year, and unemployment has “surged” to 4.1%.

To get the economy moving again, we need a functioning health care system.

A lot can be learned about handling a pandemic — and its aftermath — by looking at the health care systems in other countries. Over the past few years, we have been studying 11 countries to write a book titled, “Which Country has the World’s Best Health Care?” Taiwan was one of the countries we studied, and its successful response to Covid-19 was not a matter of luck. It was the result of careful planning and digital innovation, which the U.S. must learn from.”

Read the whole article though. It’s fascinating.

Of course, we could just stay on the course we are taking in the US, but in my opinion, it’s not a good one to me, especially with our healthcare system on the line.

The Perfect Storm Warning

While it may appear that we are cresting this current wave, that is not the case. There are two factors that are interacting to create that illusion. The minor one is a weekly wave that is readily apparent in almost any graph of the data (see the large green dot to the furthest right on any graph below). The other one is much stronger, and only became apparent after looking at it in many different ways (see the two yellow dots on each graph). The larger one has a period that increases by about 4 days each cycle.

Both of them are at the bottom of their valleys between 7/7 and 7/9. This is why it looks like cases are decreasing in the US right now. That will continue through 7/9 as the weekly cycle pushes cases back up and peaks on 7/11. That should put the US close to a 60,000 case day after which they will decline again as the weekly cycle declines.

The impact of the depression of the larger cycle will begin to fade and a large surge in cases will follow. This will be worsened by the relaxation of social restrictions around the country combined with the impact of the July 4th weekend starting which will become evident on July 25th as an unbelievable rise in cases as the larger cycle crests on July 31st. The weekly cycle also will be peaking on the 29th, so the end of the month is going to have more cases than is even imaginable. That will result in any hospital systems that haven’t been completely overwhelmed and implementing crisis standards of care already to reach that point by mid August.

In many places around the US getting infected now will put people at risk of not receiving hospitalization if necessary given the lag from infection to hospitalization. That will be true everywhere in the country in the near future and includes hospitalization for things that are not COVID-19 related.

I urge anyone who had social contact with people outside of their immediate household recently to self-quarantine for two weeks to help limit the spread.

STAY HOME

National

Alabama

Alaska

Arizona

Arkansas

California

Colorado

Connecticut

Delaware

District of Columbia

Florida

Georgia

Hawaii

Idaho

Illinois

Indiana

Iowa

Kansas

Kentucky

Louisiana

Maine

Maryland

Massachusetts

Michigan

Minnesota

Mississippi

Missouri

Montana

Nebraska

Nevada

New Hampshire

New Jersey

New Mexico

New York

North Carolina

North Dakota

Ohio

Oklahoma

Oregon

Pennsylvania

Puerto Rico

Rhode Island

South Carolina

South Dakota

Tennessee

Texas

Utah

Vermont

Virginia

Washington

West Virginia

Wisconsin

Wyoming

The Illusion is Over by State

I’ve previously described how we have been benefiting from reduced cases and thereby reduced deaths because of the social restrictions enacted by various states. As these restrictions were relaxed, I indicated we would see an alarming rise in deaths the first week of July.

It previously appeared that there was about a week delay from cases to death when looking at the national data. However, when looking at each state individually, it’s clear that some are reporting deaths relatively concurrently and some lag by up to four weeks.

The methodology is described in a previous post. This will simply be a series of graphs (with some commentary at times) of the predictive value of using case numbers to predict deaths from COVID-19. Deaths (red) are shifted one week to the left to make it easier to see how they cases and deaths align.

There is exponential community spread occurring in many states throughout the US. Avoid contact with those outside of your immediate household unless absolutely necessary and protect yourself if you do.

This is not over. It’s only getting started.

STAY HOME

As a whole, the US has about a 2 week lag in reporting deaths.
2 week lag.
1 week lag
2 week lag
2 week lag
California is one of the states where testing may account for some of the increase in cases, although there is a 2-3 week lag.
2 week lag
1 week lag
2 week lag
1-2 week lag
Florida is also likely being impacted by increased testing because people are in fear after seeing hospital systems getting overwhelmed. Reporting deaths lags 1-3 weeks.
2-3 week lag.
2-3 week lag.
Idaho started testing after death began. 1-3 week lag.
2 week lag
1-2 week lag
2-3 week lag
2 week lag
3 week lag
3 week lag
2 week lag
2 week lag
2 week lag
2-3 week lag
2 week lag

It appears that deaths are entered as batches, roughly monthly.

2-3 week lag
2 week lag
Concurrent
Testing and 1-2 week lag
Concurrent
New Jersey is an unusual situation. They were likely not adequately reporting COVID-19 deaths when they assessed excess deaths. They fixed the data which accounts for the large, steep spike.

Two week lag (plus prior underreporting).
1-2 week lag
Concurrent
2 week lag
3 week lag
Possibly testing and 2 week lag
3 week lag
Concurrent
1-2 week lag
Puerto Rico has a unique feature. There is a sharp point around June 10th. Normally these crests are rounded, which makes me wonder if they had a mass testing day, but I couldn’t find anything related to that when I searched.

Concurrent to 1 week lag.
1-2 week lag
Testing likely accounts for some of the increase in cases in South Carolina.

One week lag
4 week lag
3 week lag
Testing probably plays a partial role in increasing cases.

2 week lag
2 week lag
2 week lag
Concurrent

1-2 week lag

2 week lag
1 week lag
2-3 week lag

US State Forecast Dashboard

II thought I would provide what I see nationally with case data for the next 10 days: 3 days of growth, 4 days of remaining relatively stable, two days of growth, and one day of drop. Obviously, the further from the present the harder this is to do.

I thought I would make a dashboard view for the US.

The second column (Current) is my categorical assessment of what is happening in the state currently.

The third column (Sustained/Forecast) is colored using the same categories of the second column, but may also have a date which indicates when I either would have expected sustained changes or when I do in the future using the first of four days over a certain threshold.

The fourth column (Expected Increase Start) is the expected date for increases in cases to be noted within the state.

The fifth column (Community Spread) is when I believe that community spread started accounting for the current status of the state.

The sixth column (Hosp) is when I expect(ed) hospitals will start seeing patients increases. This can lag by 1-2 weeks.

The final column (Deaths) is when the mortality figures should start. This can lag by 1-2 weeks.

Some states are highlighted yellow. These are ones where I used a little more judgement or expect them to be influenced by something much bigger, so there is more interpretation of the raw data.

There is a pattern in the data that has much bigger impacts on the daily incidence of the disease than the seven day cycles that are easy to see. There is a valley to one of these coming up on 7/6-7/7, making it appear that things are better nationwide for a few days on either side as it pulls cases downward. The next peak for it will be on 7/31-8/1 when it will pull cases up.

I’m still trying to account for what drives this cycle it but it has a pattern of lengthening by four days per complete cycle so far. My thinking is that it might have to do to irregular pay schedules such as Social Security checks or those who get paid once or twice per month. Those differences could have set off this unusual cycle as those who are spending money and socializing out of sync with the two week payment cycle of other workers. I’m convinced that the weekly cycle that is easily seen in the data is the result of social activities on the weekends.

Of course, this dashboard in no way indicates that you will be safe interacting with people. It’s only meant as a guide to where problems currently lie and where they will be escalating, especially when it comes ot impacts on the healthcare system.

I won’t be doing any social activities over this holiday weekend. I would suggest that you think twice before doing so.

STAY HOME

The Illusion is Over

Right click images to view full size.

A lot of people have tried to argue that the increase in cases is a function of more testing. While testing may contribute to some degree, there is more than enough signal in the noise to prove that what is actually being captured is true disease.

In this graph, I’ve used the same derivative formula for both the case data and death data. I’ve adjusted the scales of each to make the curves clearly visible as well as to align them along the zero of the y-axis. I then created 7-day moving trend lines for each and made the original jagged slope graphs invisible for the sake of clarity.

According to the National Center for Health Statistics related to COVID-19 deaths, “it can take several weeks for death records to be submitted to National Center for Health Statistics (NCHS), processed, coded, and tabulated.” This means that many of the deaths still are not captured in this data. As I have been studying it, I’ve found that the final count of deaths to lag about a month, so that would explain some of the spread in more recent data.

There is a case to be made that there is probably increased testing in states that are having an alarming number of cases and have started seeing hospital bed shortages. The media attention to this has probably increased testing in those areas. I adjusted for this by eliminating states where I have either heard in the media or from friends that hospitals are getting full or diverting patients. That led me to filter out AZ, CA, FL, NC, SC, and TX. The resulting graph is pretty telling that the current increase in cases around the country in June is closely matched by deaths.

The reason I say that the illusion is over has to do with the location of the red (death) trend line. It’s now moved above zero. We are going to start hearing more and more about the death tolls in the news.

My takeaway from this is that there is significant community spread going on around the country. I would argue that if you are planning on going to any events for the holiday weekend, you will be putting yourself at risk of infection and those that you subsequently come in contact with should you become infected.

STAY HOME

Rationing Life

I originally posted this on 3/29. It bears repeating now.

It sounds Draconian, but this is the reality of what is around the corner.

A SOFA score is an assessment of patient morbidity and mortality in an ICU setting, or simply put, it gives an estimate of their prognosis. It uses a number of different variables to reach summary score. The SOFA score has been proposed as a triage tool for scarce medical resources for many years.

The linked document is meant as a template policy that could be adopted by different health systems and modified to their needs.

One thing that is worth noting is that there is an appeal process. However, given the volume of patients that will be needing ICU support during the pandemic, there was one line I found very interesting:

“The appeals process must occur quickly enough that the appeals process does not harm patients who are in the queue for scarce critical care resources currently being used by the patient who is the subject of the appeal.”

While people might be used to very long appeals processes in the normal day-to-day world, this will obviously be quite different and will need to be done very rapidly.

There is also a very good article titled “A Framework for Rationing Ventilators and Critical Care Beds During the COVID-19 Pandemic” in JAMA on this topic.”

7/1 Addendum: Arizona took this step yesterday. Other states won’t be far behind.

STAY HOME