
It previously appeared that there was about a week delay from cases to death when looking at the national data. However, when looking at each state individually, it’s clear that some are reporting deaths relatively concurrently and some lag by up to four weeks.
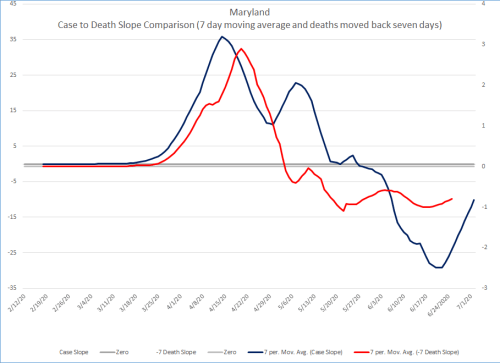
The methodology is described in a previous post. This will simply be a series of graphs (with some commentary at times) of the predictive value of using case numbers to predict deaths from COVID-19. Deaths (red) are shifted one week to the left to make it easier to see how they cases and deaths align.
There is exponential community spread occurring in many states throughout the US. Avoid contact with those outside of your immediate household unless absolutely necessary and protect yourself if you do.
This is not over. It’s only getting started.
STAY HOME


It appears that deaths are entered as batches, roughly monthly.


Two week lag (plus prior underreporting).


Concurrent to 1 week lag.


One week lag


2 week lag


1-2 week lag


