I had done a little calculating in my head last night and was very disturbed. I wasn’t even sure if I should talk about it, but I decided I would sleep on it and run the numbers more carefully this morning. I had the same result.
I used a case attack rate of 20% (that’s the percentage of the population that will get infected). To put that number in perspective, the 1918 Spanish Flu is estimated to have infected 20-30% of the world population.
Next, I used the case fatality rates I’ve been tracking for weeks. For the low end, I used the numbers from South Korea, for the midrange the global average, and at the high end, Italy.
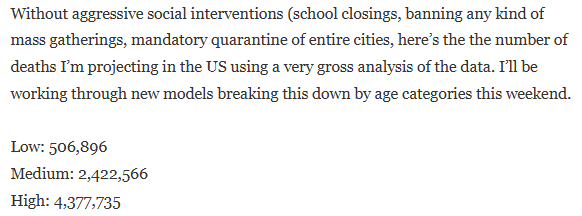
Without aggressive social interventions (school closings, banning any kind of mass gatherings, mandatory quarantine of entire cities, here’s the the number of deaths I’m projecting in the US using a very gross analysis of the data. I’ll be working through new models breaking this down by age categories this weekend.
Low: 506,896 Medium: 2,422,566 High: 4,377,735
In context, a normal influenza season in the US, we have about 36,000 deaths each year. Do you understand why this is different than influenza?
I don’t know what else to do to get people to take this seriously. We are in trouble and are way behind the eight ball in the US.
ADDENDUM
10/10/26 On the morning of 10/6 while listening to a podcast, I wondered how well my estimate played out. When I wrote this initially, I was thinking that the high estimate was the most likely value, but I also didn’t want to cause too much alarm among the public, so I picked the experiences of some other countries to help dampen that fear a bit. I wrote this thread later that day on various social media platforms.
This morning something came to mind related to COVID deaths and deaths avoided from vaccine. It also got me thinking about one of the earliest respected physician scientists to downplay it, John Ioannidis.
On 3/17/20, Ioannidis stated what is seen in the screenshot. He later stated both on Tucker Carlson Tonight and on The Jamie Glazov Show that there would be 10,000-40,000 deaths in the US.
Let’s back up to what I wrote on 3/13/20. I was obviously a little worried how we could be so far apart given his reputation.
Let’s do the math starting with my estimate of unmitigated death.
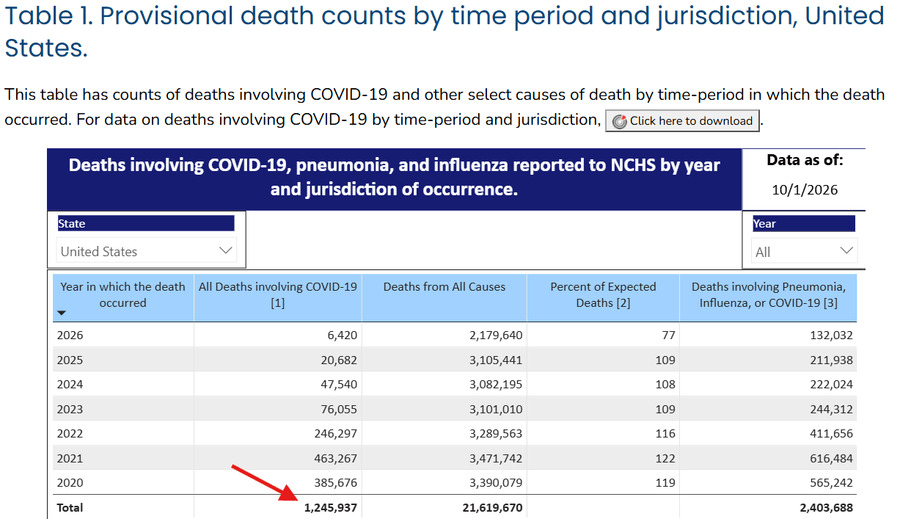
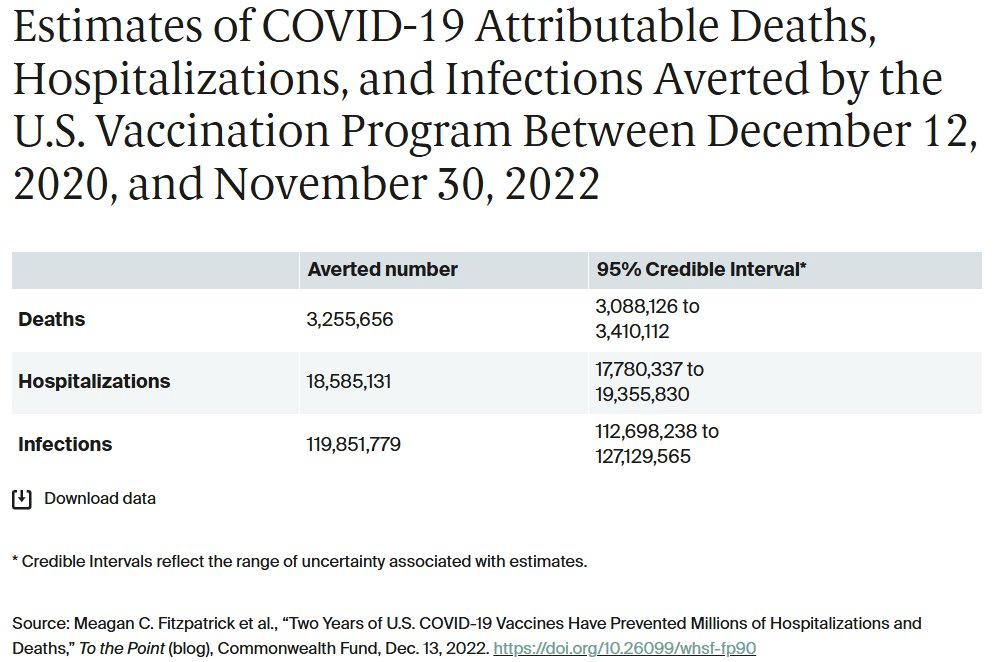
4,377,735 (my estimate) – 1,245,937 (actual deaths to date) – 3,255,656 (est. vaccine prevented deaths x 2yrs) = -123,858
That means I was only off by 2.8%. However, we should remove the deaths since 2022 to align with the vaccine estimate. Total deaths between 2023-now are 150,697.
Revising the death total the means that my actual estimate was off by (150,697-123,858), or 26,839. That means my estimate was off by only 0.6%. I am REALLY damn proud of that.
I would also add that when Ioannidis began pandering to right wing news media, he set the ball in motion for much higher deaths among Republicans. That seems like blood on one’s hands. https://icemsg.org/the-republican-democrat-covid-divide/
Since I wrote that thread earlier, I had a couple of other questions come to mind. First, I wondered what the death toll was in the US at the time I wrote my original estimate. I looked back at the data. There were 39.
The second I was curious about was other predictive models. We already know how badly Ioannidis did.
35,000 – 1,000,000 – Nicholas Christakis, Yale (4/7/20) – “I would say there’s a 99 percent chance that we will have at least 35,000 deaths, a 75 percent chance that we will have at least 50,000 deaths, a 50 percent chance that we will have at least 100,000 deaths, a 25 percent chance of 300,000 deaths, and a 5 or 2 percent chance we’ll have 1 million deaths. Part of the reason that epidemiologists are so uncertain is that this thing has only been on the planet for two or three months.” https://www.thepublicdiscourse.com/2020/04/62065/
<1,500 – Douglas Frank (3/15/20) – After his miserable failure with this, he went on to be a major election fraud conspiracy theorist. https://drfrankmodels.wordpress.com/
I still can’t quite fathom how so many people were so far off while I was this close with likely less data available to me.
Addendum 2
Last night I remembered that the averted deaths only went through Nov 2022. That means that I should have subtracted those to assess the quality of my death estimate. The number of deaths for Dec 2022 was easy to find.
I may have had a typo when entering figures into my calculator app yesterday. I used a spreadsheet to calculate the percentage difference of everyone listed. Regardless, my estimate was still <1% off of the actual deaths. The higher the percentage off, the worse the estimate. For comparison:
Notes: For MIT, they predicted 600,000 infections. Assuming 1% mortality, that means their figure would have meant 6,000 deaths. For Trump’s first estimate of “close to zero,” I entered 5 as the value to calculate the percentage difference.
Although the calculations are not as straightforward as they seem (there are many variables) I believe you’re right. My calculations showed a 1 million mortality number in the US. So much of this is due to federal decision making. I wrote a post about it a couple of days ago if you’d like to check it out.
I absolutely agree. I simply wanted to get the first rough one out as a means to wake people up to how serious this is.. I’m going to keep developing it as I get more ideas how to refine it.




Although the calculations are not as straightforward as they seem (there are many variables) I believe you’re right. My calculations showed a 1 million mortality number in the US. So much of this is due to federal decision making. I wrote a post about it a couple of days ago if you’d like to check it out.
I absolutely agree. I simply wanted to get the first rough one out as a means to wake people up to how serious this is.. I’m going to keep developing it as I get more ideas how to refine it.
Sounds good. You’re right, many aren’t taking it seriously and need to wake up.
Pingback: US Mortality Projection by Age | IP/EM/Safety
Pingback: South Korea's Example, or Choose Not to Be Selfish | IP/EM/Safety
Pingback: COVID Impact Levels | Infection Control, Emergency Management, Safety, and General Thoughts