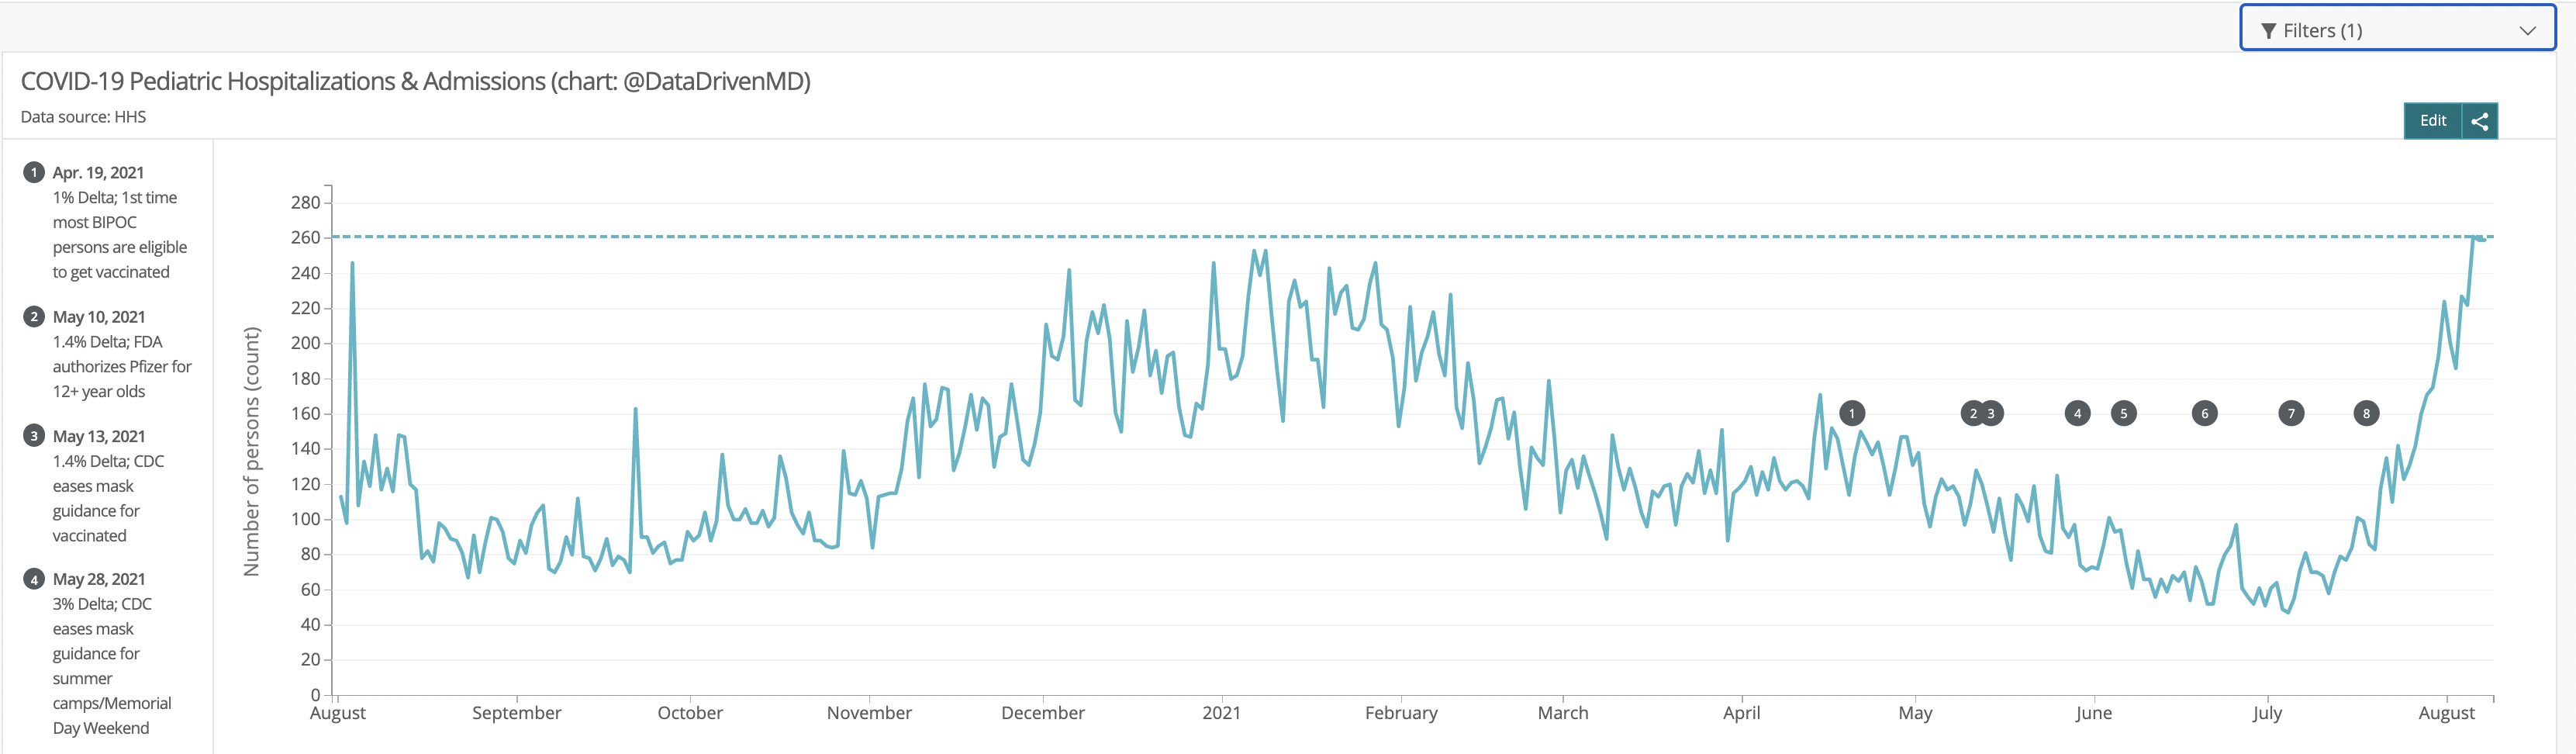
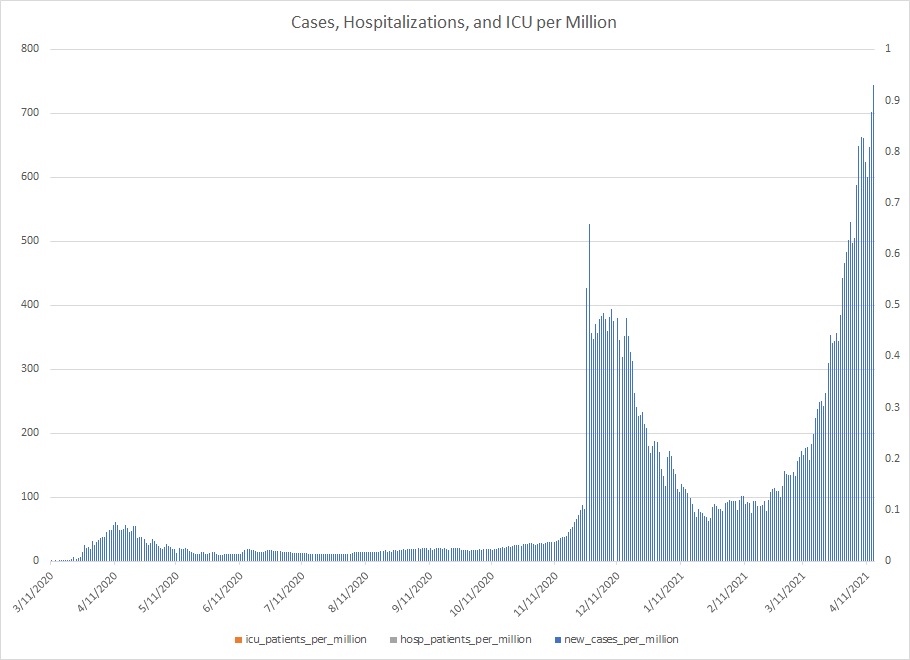
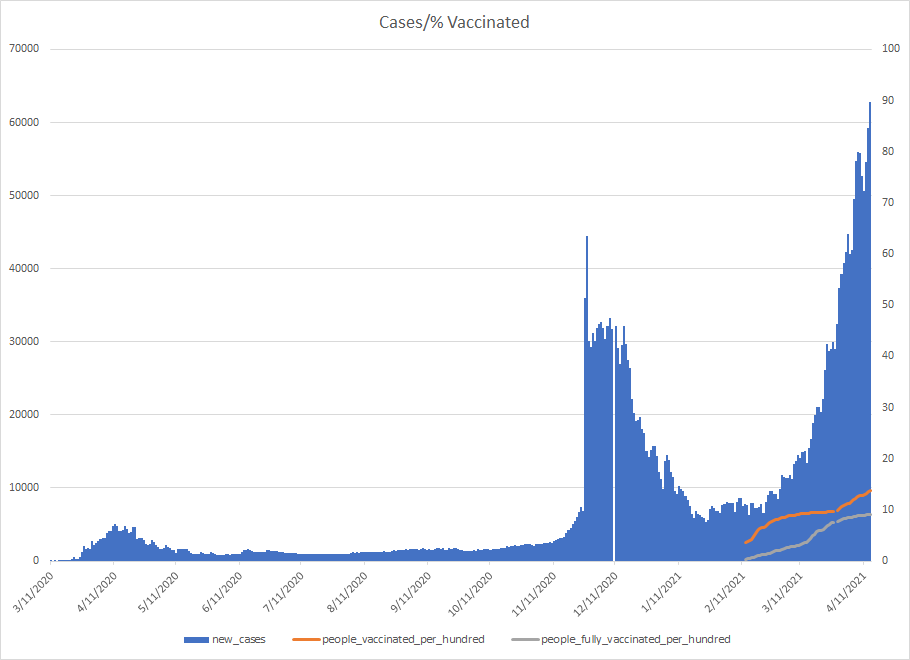
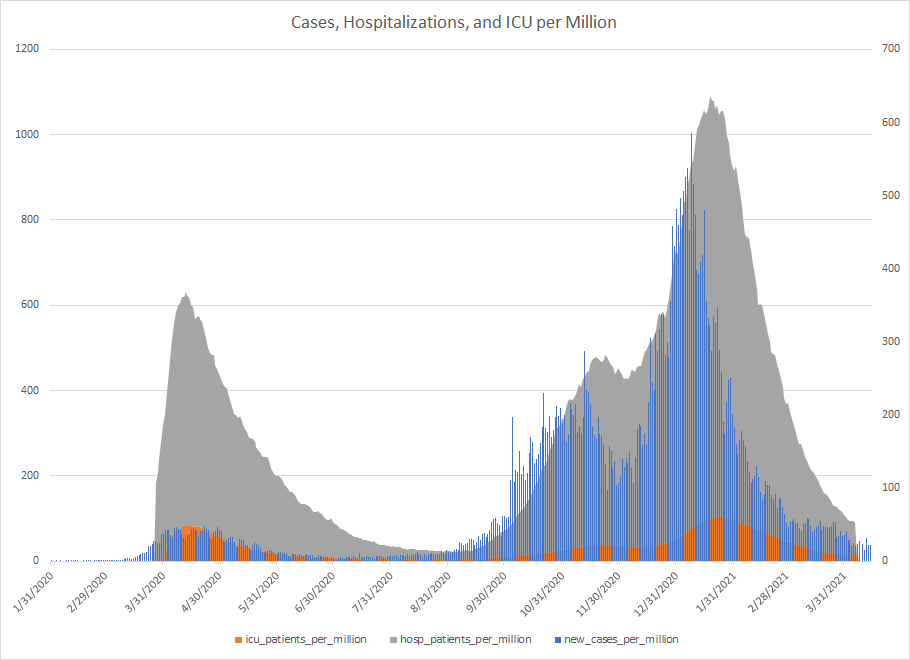
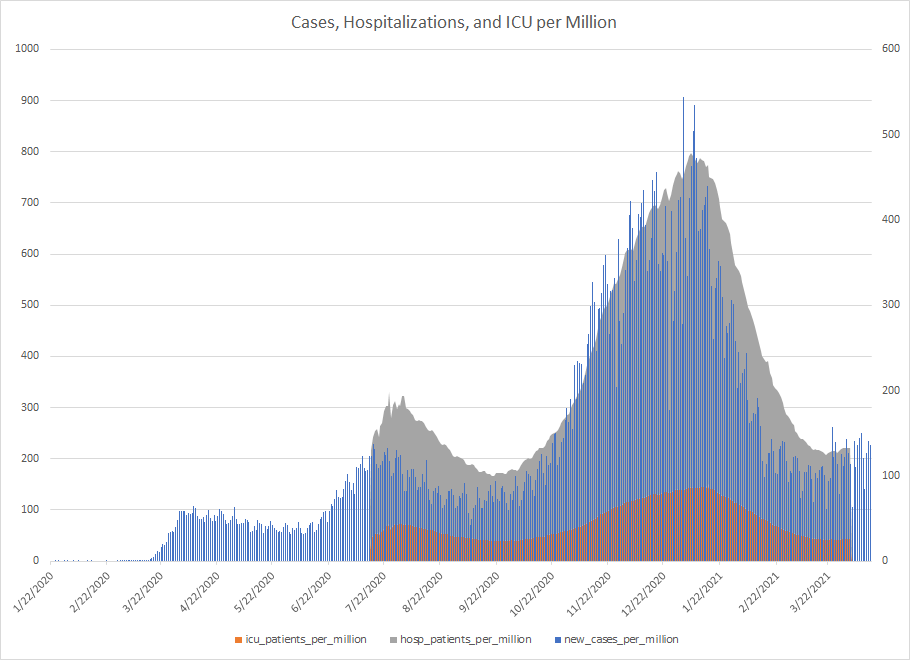
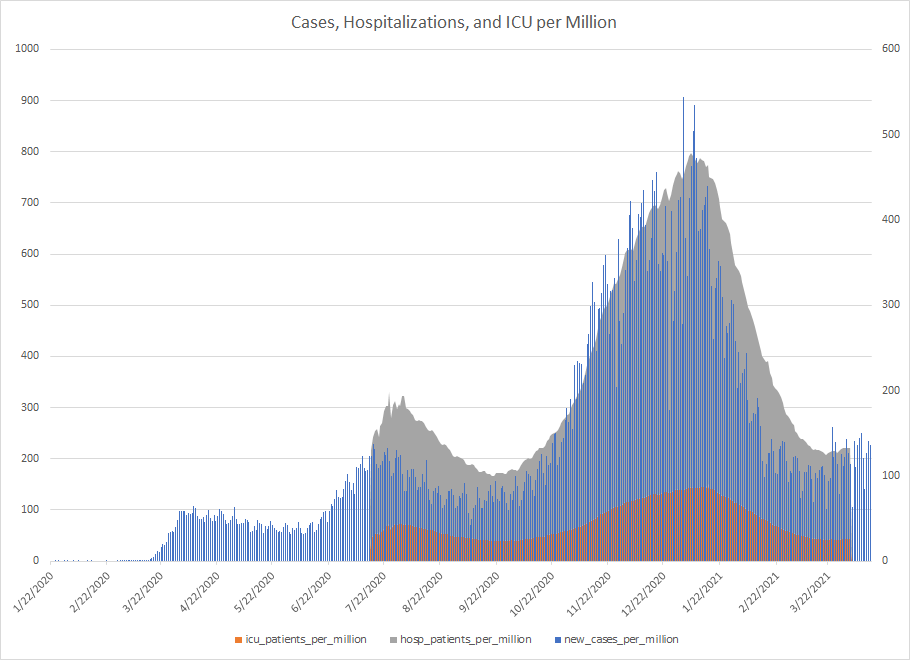
I am simply shocked that schools are opening. Children under 12 haven’t been vaccinated and not many have that are older. Delta is readily spread via the airborne route and this not only will make this wave considerably worse, but could very well badly impact the health of many more of these children than we realize given the way that the virus damaged tissue and organs, often in ways not immediately detected. My fear is an epidemic of diabetes, heart, liver, and lung disease, neurological problems, and many others. There are numerous examples to support that, but I’m going to sum it up from one Tweet that fits the data I’ve pulled on pediatric hospitalizations.
Here’s what I would do:
If my child was under 12, I would pursue virtual schooling.
If my child was not vaccinated, I would pursue virtual schooling.
If my child had any comorbidities, I would pursue virtual schooling.
If anyone in my household wasn’t vaccinated or had comorbidities, I would pursue virtual schooling.
If my school district didn’t have mandatory masking, I would pursue virtual schooling.
If my school district didn’t require vaccination for those eligible aside from legitimate contraindications, I would pursue virtual schooling.
If I had the slightest hesitation about my child’s safety on a bus or in the school, I would pursue virtual schooling.
2020 election outcome data for the presidential race was used to group voters by county into six strata:
80-100% Republican
60-80% Republican
50-60% Republican
50-60% Democrat
60-80% Democrat
80-100% Democrat
Each of these strata were pooled for both 2010 population per the US Census Bureau and the incidence of COVID Cases. Due to the geographical election structure not aligning with county structure in Alaska, Alaska was excluded from this analysis.
The pooled COVID cases for each strata were then calculated as an incidence rate per 100,000 per calendar day. A 7-day moving average was then applied to each strata to remove some of the normal weekday variations and each line on the graph was colored to represent the degree of dominance of a political party (dark red represents >80% Republican, dark blue represents >80% Democrat) by 2020 presidential vote.
The hypothesis was that the more strongly a county voted Republican, the more likely it was to listen to and be influenced by misinformation and disinformation channels.
Results
There is a clear gradient in case rates depending on the political leanings of counties. This has remained consistent over time with two exceptions.
When the pandemic first started, a large proportion of the spread was in New York City. This was before there was a good understanding of the mode of transmission and in a very dense population area. As the virus spread into less populous area of the country and more knowledge was gained about transmission, other factors became more important in spread, such as messaging and beliefs.
The other anomaly in this pattern is in the spring of this year. This could be an effect of college students traveling during spring break, who are at an age where they are eager to return to normal and more likely to be a source of asymptomatic community transmission.
For better clarity in just how big the differences are in the extremes, the next graph only shows the >80% wins in the election. Except during the rapid case declines that were due to the vaccination efforts that reduced spread and the previously noted exceptions, the rates of new cases in strongly republican counties were almost four times as high as those in strongly democratic.
Discussion
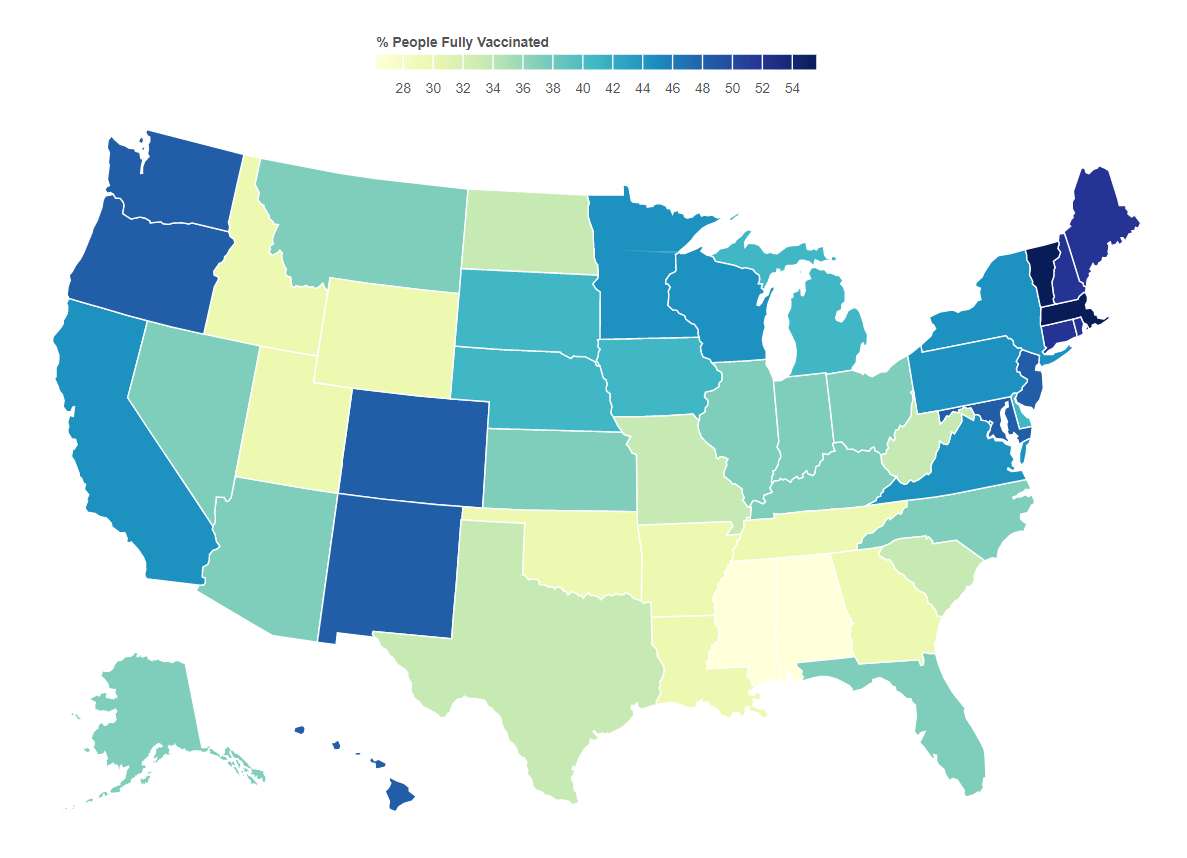
This becomes much more important as it related to vaccination efforts. As of this writing, the vaccination rates by state correlate well with voting. A current view of this map can be found here.
The majority of lies and disinformation seems to spread mostly in right wing media and is instigated by twelve different people. This is causing irreparable harm to health and to the economy. Sadly, as new variants come to dominate cases, the spread will be most obvious among those who have been fooled by these sources. What remains to be seen is whether the media will be held responsible for the damage they have caused.
Do your part. Get vaccinated. Encourage others to do so. As B.1.617.2 (the delta variant) gains a foothold, your health and life may depend on it.
An Epilogue
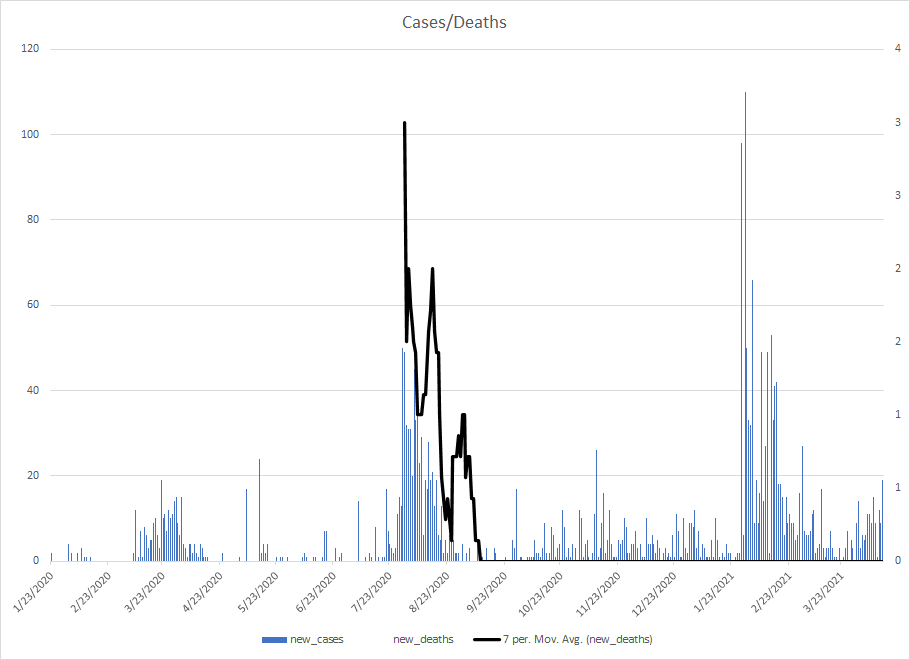
There is a similar pattern for deaths when stratified the same way, which is not surprising at all. The two big jumps for about a month in May 2020 are due to states catching up on death reports and submitting them all at once.
8/21/21 Addendum. Fox “News” carries some responsibility for what is happening by allowing lies like this.
12/4/21 The rapid drop in the 80%+ Republican counties the past few weeks has been puzzling. The data hasn’t been tracking with that of the other strata. One possible explanation might have something to do with those who move south for the winter. However, the data this week painted a darker picture. While it may be easy to skew case data by not reporting it, it’s much harder to do so with death data. While this certainly doesn’t draw any specific conclusions, it certainly supports evidence that some governors have been trying to hide the impact in their states.
12/9/21 It appears that data from a very red state has been suppressed for about a month.
I am honestly stunned by the change in the mask recommendation from the CDC today. I am very concerned that this is a political decision.
While it is likely reasonably safe for those who have fully vaccinated to be around each other, the problem lies in that many of those who have been resistant to mask use are likely the same population who is resistant to vaccination. While this may be fine for people in the short term, it ignores some major behavioral problem.
It’s unlikely that those who have been resistant to various non-pharmaceutical interventions will start wearing masks now. Worse, it may embolden them to do more as they please in a much more belligerent manner and may lead to harassment of those who still do.
In my opinion, this change ignores the larger, long-term problem. It’s only been a couple of weeks since we hit the highest number of cases globally since the beginning of the pandemic. The high number of cases increases the chances of the emergence of new variants. While the vaccines seem to provide some degree of protection against the current variants of interest, that does not guarantee that will be the case with new ones that emerge.
The emergence of a new variant with low vaccine coverage and high transmissibility could be even more dangerous beyond just medical reasons. It could easily be twisted by those who resist guidelines to influence those who still are on the fence about the real science to think that the various non-pharmaceutical approaches aren’t beneficial, when just the opposite is true.
When there has been considerable and justified complaints about mixed messaging from the government, this simply fuels the fire for the future. I would argue that we should be continue normalizing mask use indoors in public spaces and outdoors in crowds, not the opposite.
I’ll keep wearing mine even though I’m fully vaccinated. I urge others to do the same.
One of the most difficult things through the pandemic has been getting people to wrap their heads around the idea that there is a much greater impact than just deaths. While that is an easy metric to consider, it is only one of many serious impacts.
I have been looking at this through a framework of four levels of impacts, each with different degrees of severity on society.
Secondary impacts are also relatively easy for most people to identify. This includes cancelled surgery, delaying medical or dental care, and other means needed to keep healthcare available for surges of patients, mental health issues, and the direct economic and social impacts on individuals and local communities.
While both of those are concerning, what tends to give me the most pause are tertiary and quaternary impacts.
Tertiary
I classify tertiary impacts as those that have much more widespread impacts which can be global in scale. One of the obvious ones that is somewhat predictable during a pandemic is social unrest. While it was impossible to determine what the trigger event would be, it was almost inevitable. During 2020, one of the ways that showed up was the global Black Lives Matter protests in response to the murder of George Floyd in Minneapolis.
There is much more to the supply chain story though. We are considerably MORE vulnerable than was the case during the Spanish Flu in 1918-1919. During that time, travel times were longer, which would keep any kind of mutations in the virus somewhat localized. Now, most places in the world can be reached within 24-48 hours.
Another bigger problem exists today compared to then. Warehouses filled with stock were the norm and much of what was needed locally was produced locally. That all changed with the development of the container ship and even more with air freight. Companies no longer had to keep large stocks of all of the materials they needed to produce their products due to “just in time” manufacturing. It reduced the need for large stockpiles of supplies and relied on shipping from upstream vendors to have the goods ready when needed on the manufacturing floor. This is a much more vulnerable approach to manufacturing. The surge in India is having a massive impact on the shipping industry, which will further complicate the supply chain problems.
India and neighboring Nepal are both surging in cases. As the incidence of the disease climbs, the chances of mutations increase, which can easily result in the emergence of new variants. A new variant which has enough of a mutation could bring the world right back to square one with what would be the equivalent of starting an entirely new pandemic. Fortunately, now that we have some of the vaccine infrastructure in place, creating a new vaccine for a variant should happen more rapidly if needed.
Another big supply chain that is going to have a major impact is plastics. This was a result of the winter storm that impacted Texas. Beyond consumer goods though, think of how many plastics are needed in healthcare for things like syringes, ventilator tubing, and many other products.
There are many other sectors with supply chain problems, all of which will ultimately lead to increased consumer prices, which will impact those on the lower end of the socio-economic scale the hardest. Those kinds of issues can lead to further social and political unrest.
Quaternary
The worst impact by far though would be what I consider the quaternary impacts. As one can see, each level feeds upward into the next. The tertiary impacts are the kindling needed for major political and social disruptions. One cannot conclusively say that the coup in Myanmar was a direct result of the pandemic, but the pandemic certainly makes such types of moves much more likely.
There are many other areas of concern as the pandemic continues to grow, such as Israel/Palestine/Iran, India/Pakistan, China/Taiwan, Russia/Ukraine, etc. When the social and economic conditions are right, like are developing right now, a single event can start a war, such as how the assassination of Archduke Franz Ferdinand started the chain of events that led to WWI.
I’ve noticed a shift in thinking in the US. Not only have we had people who have denied COVID, the effectiveness of masks, social distancing, and a ton of conspiracy theories to contend with, but now with vaccination, even those who have been taking it seriously seem to think that it’s over.
Both global cases and deaths are about to climb into new highs.
The next graph shows cases with the slope of the rate of case climb or fall. It forecasts ten days into the future and shows global cases moving into a much higher rates of spread.
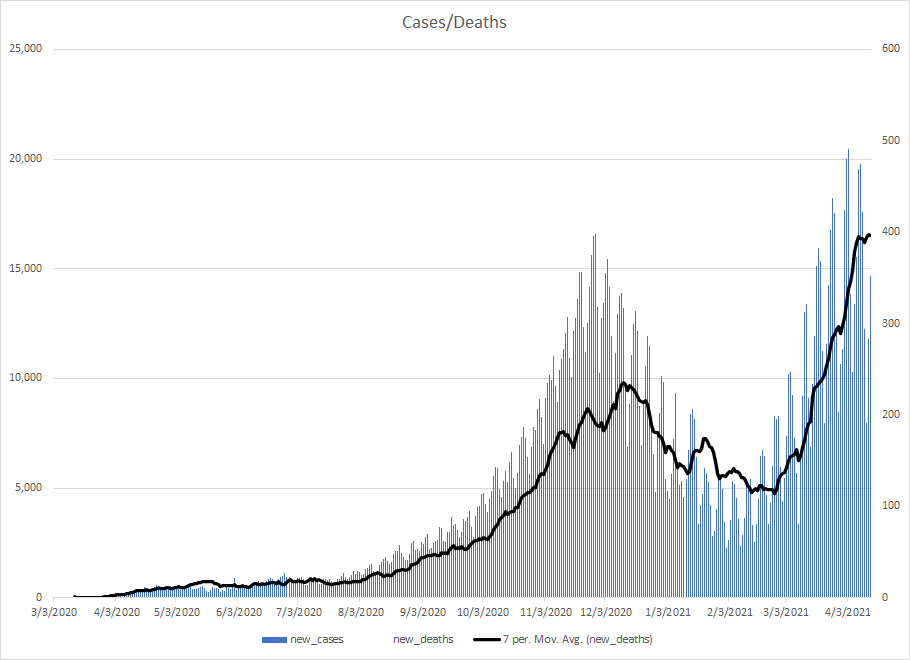
The situation in India is but one example, but it is horrifying given their population density and global impact. Everyone should be very alarmed that they have gone from about 25,000 cases/day to almost 250,000 cases/day in just over a month.
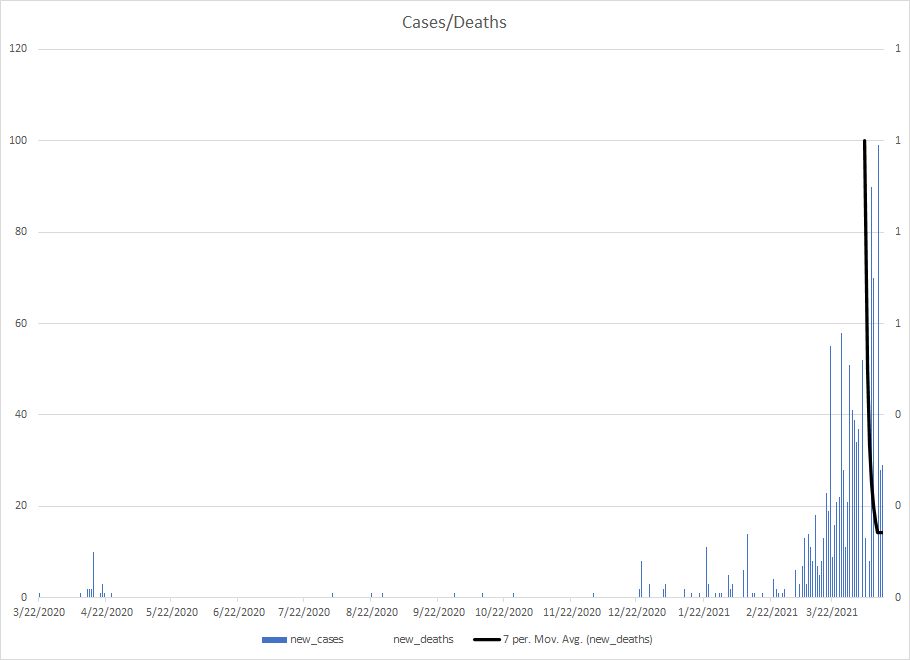
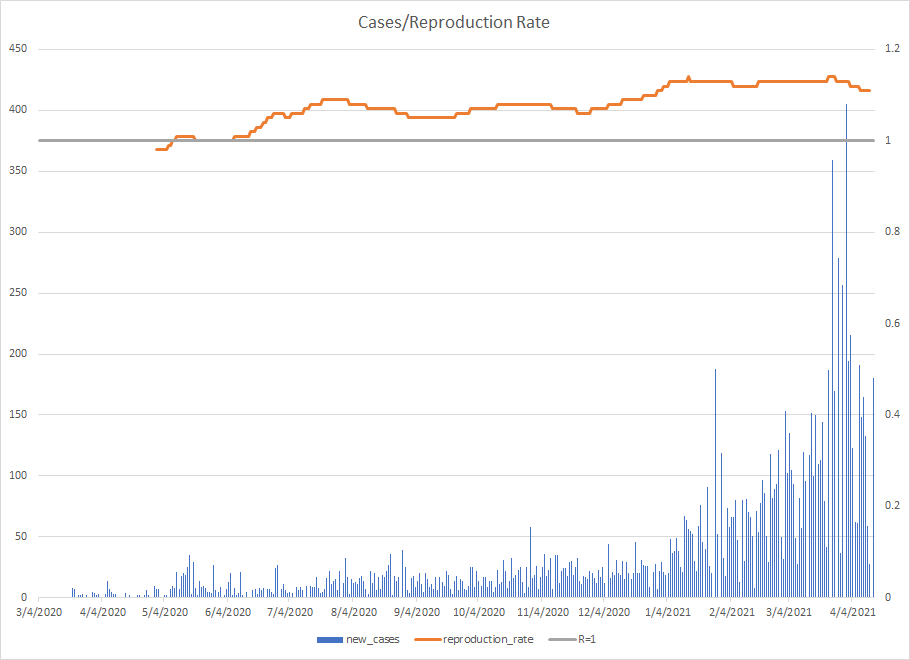
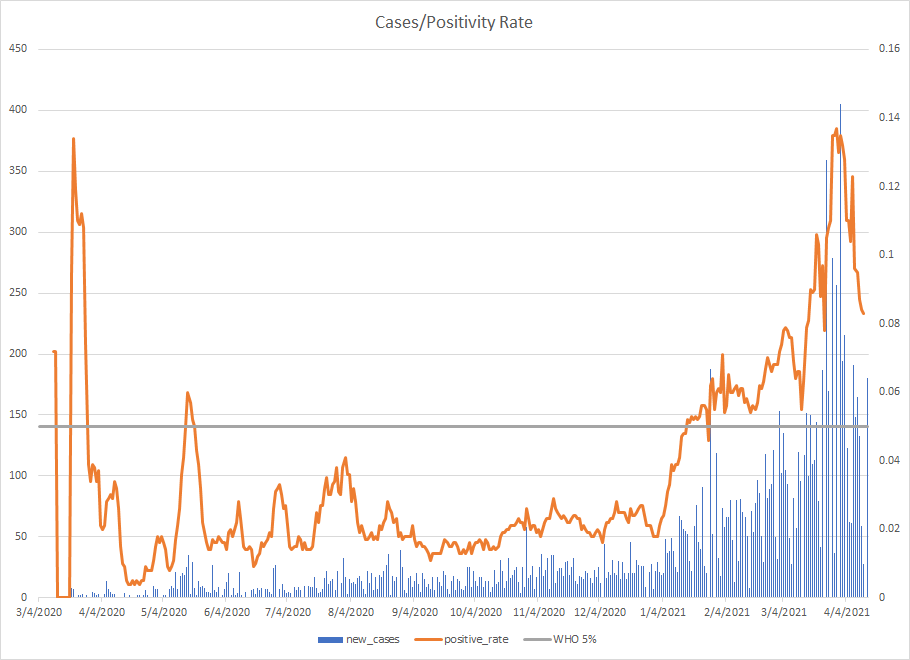
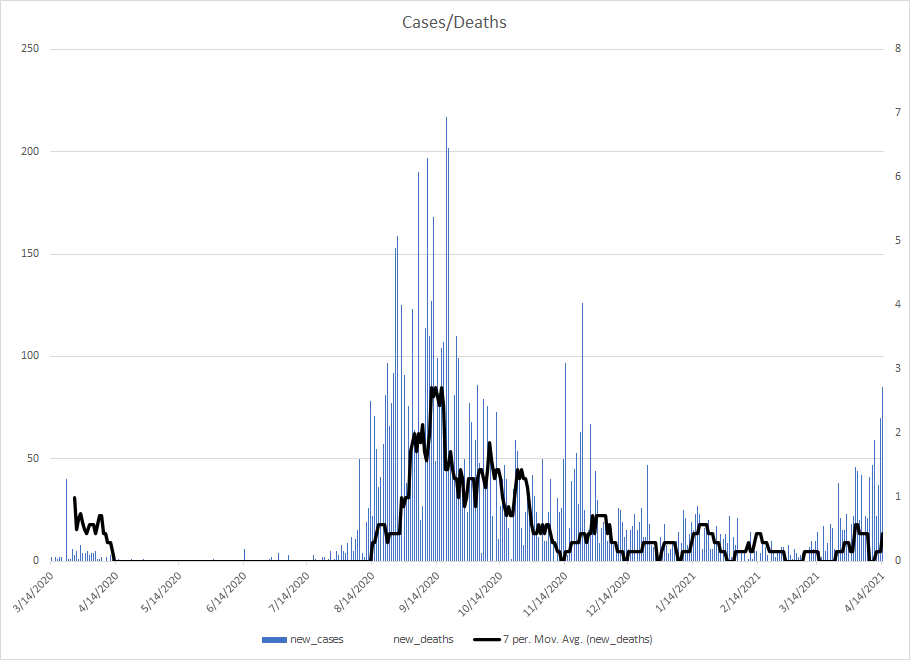
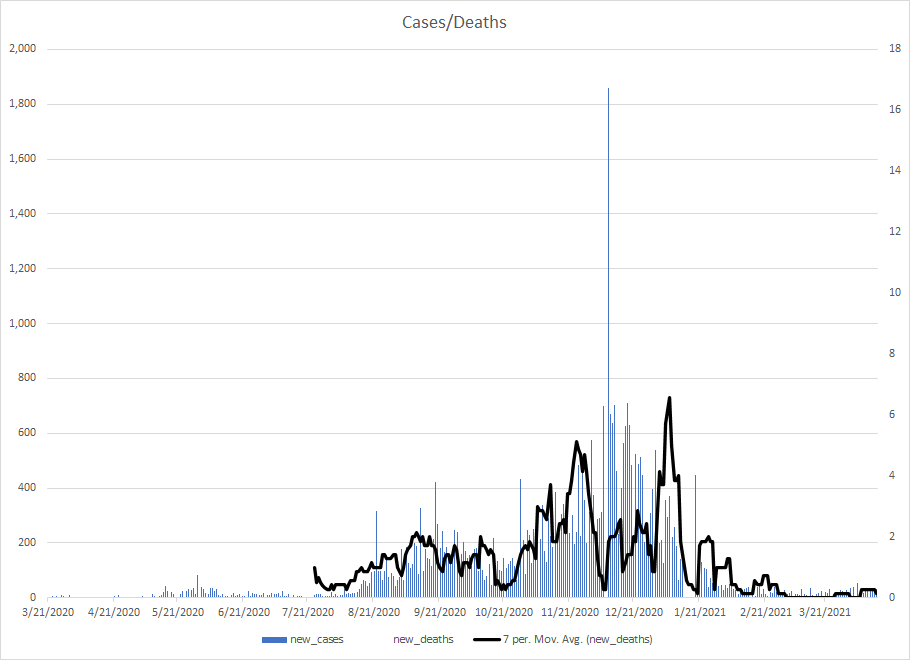
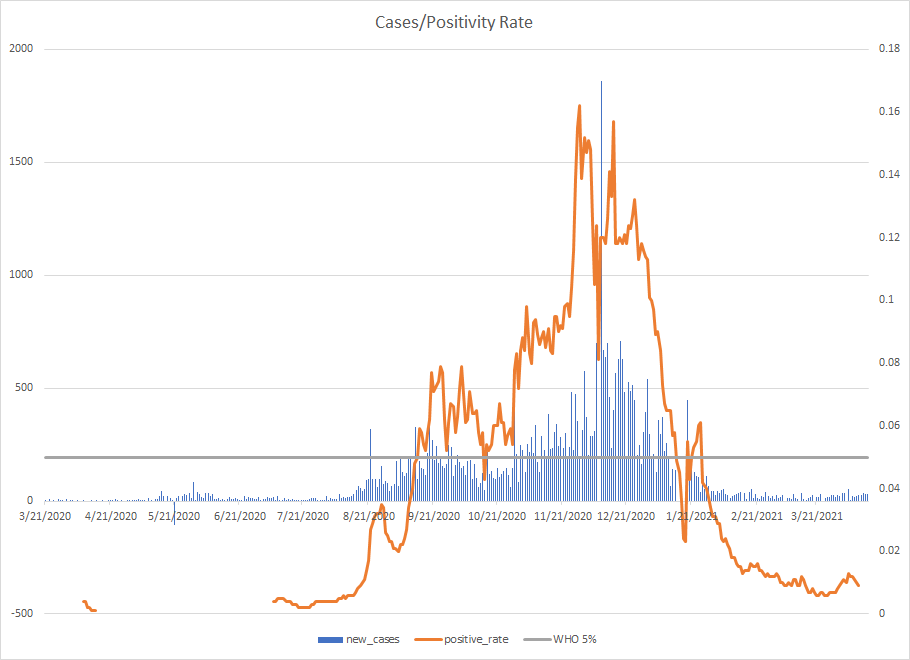
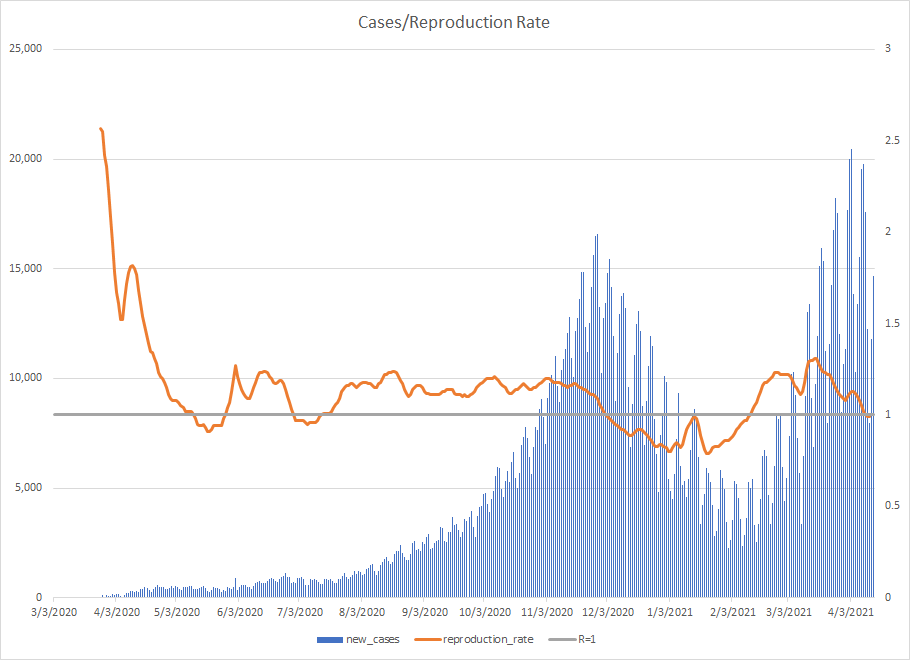
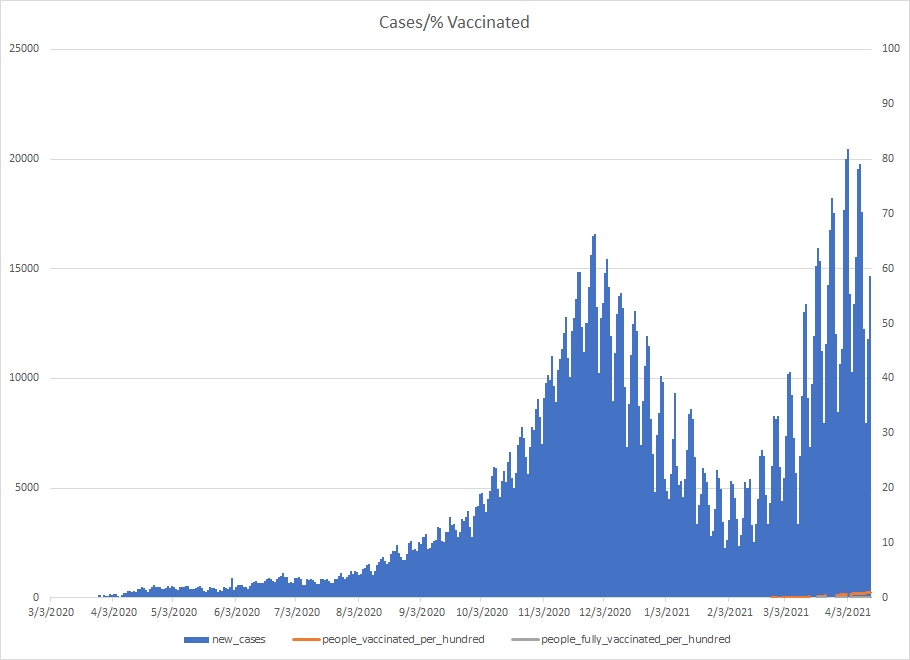
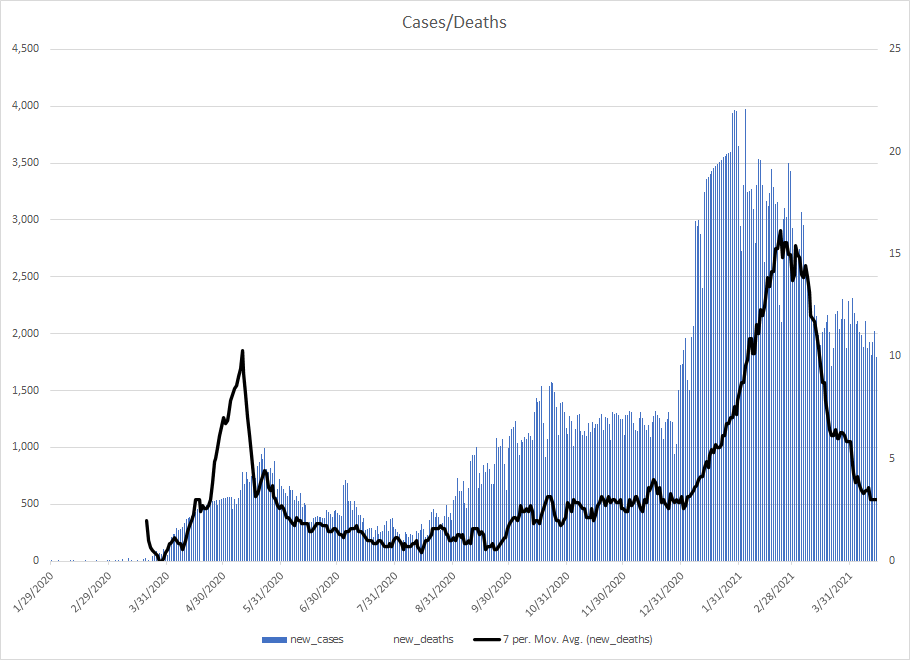
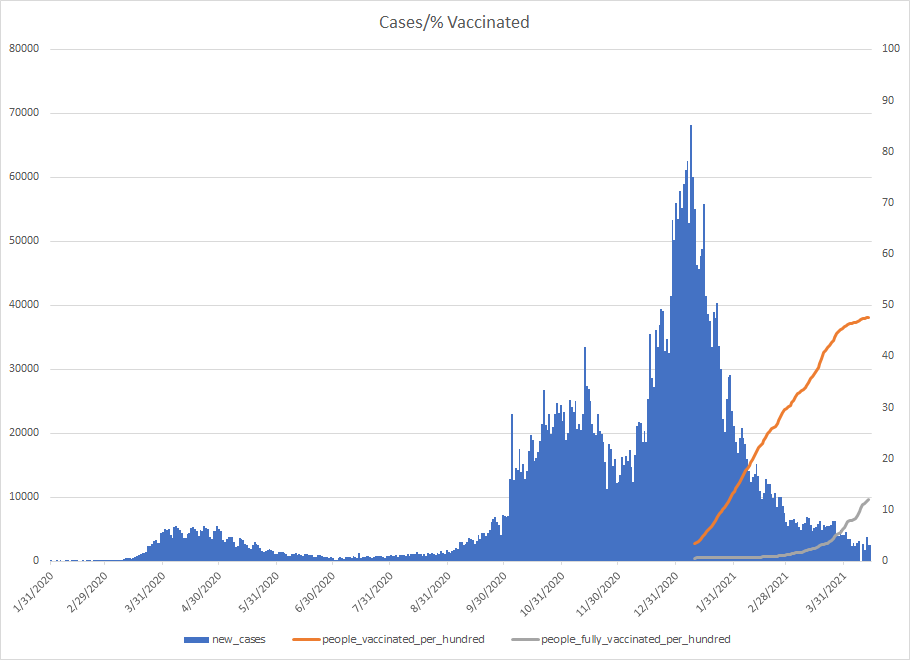
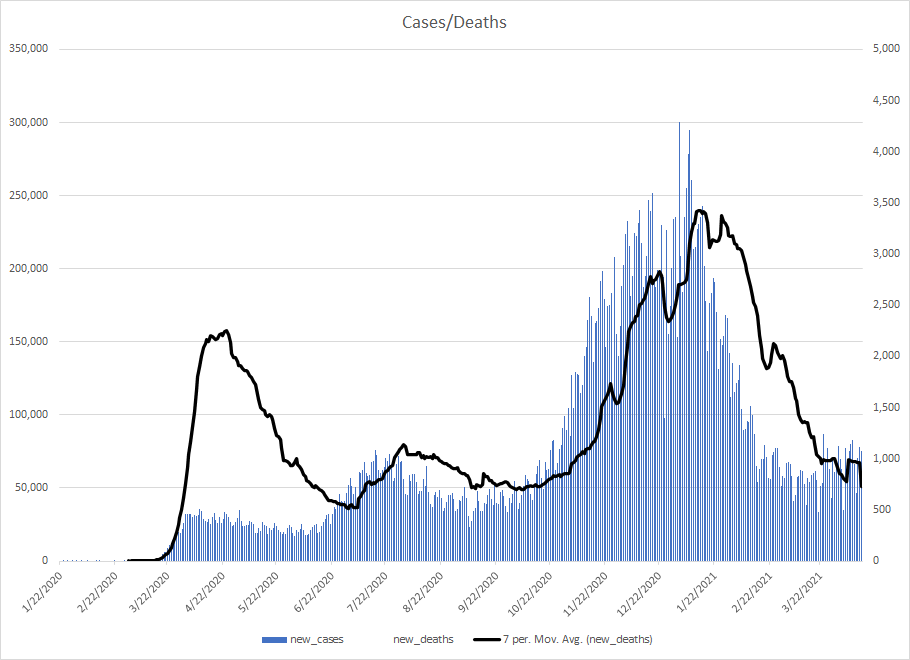
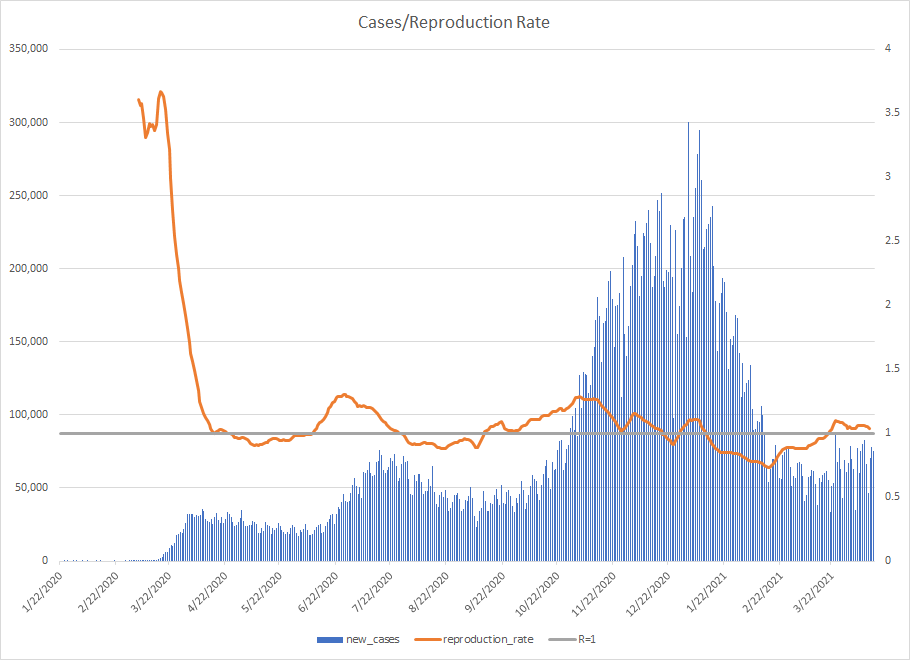
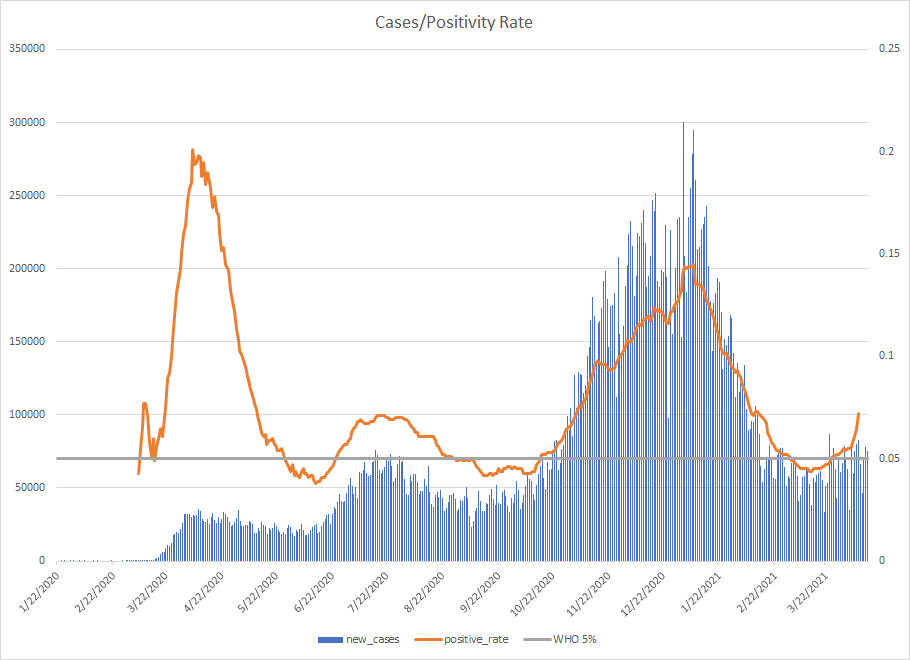
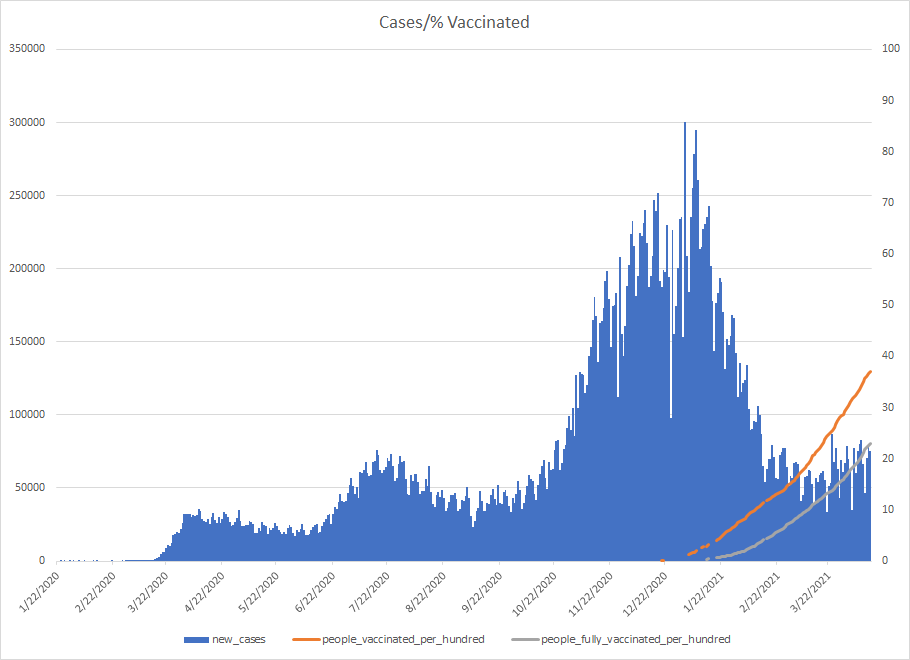
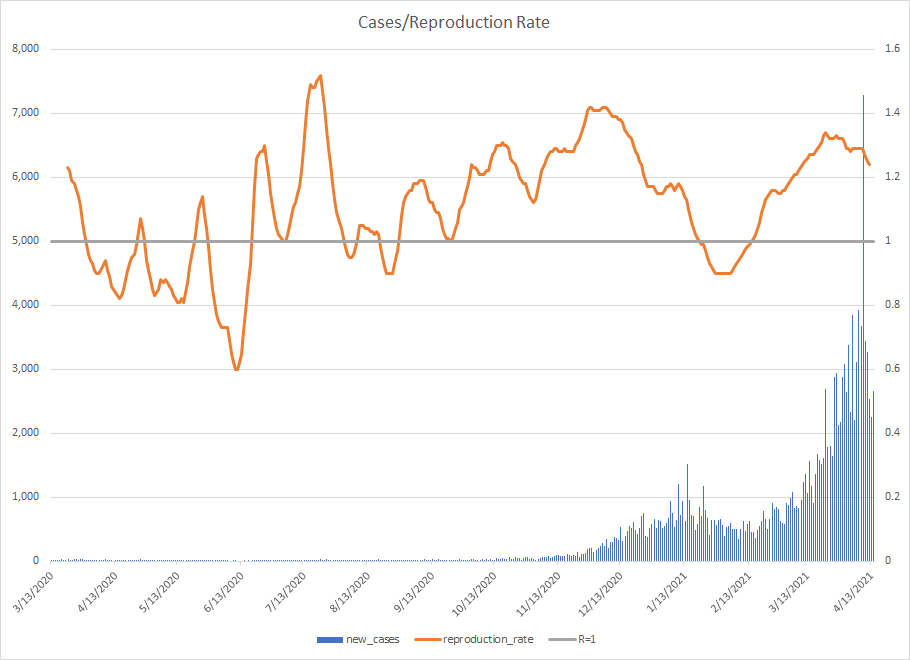
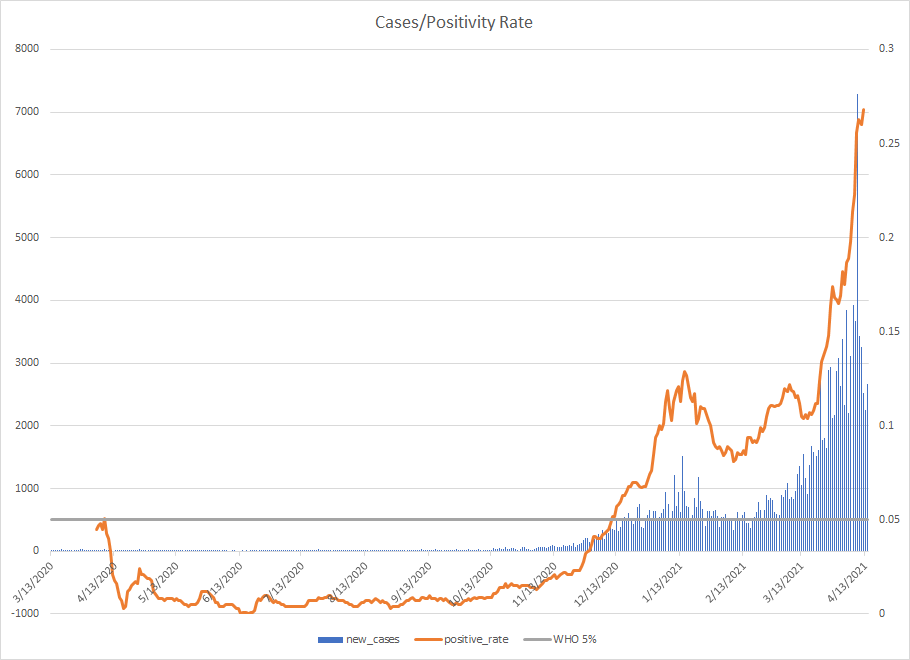
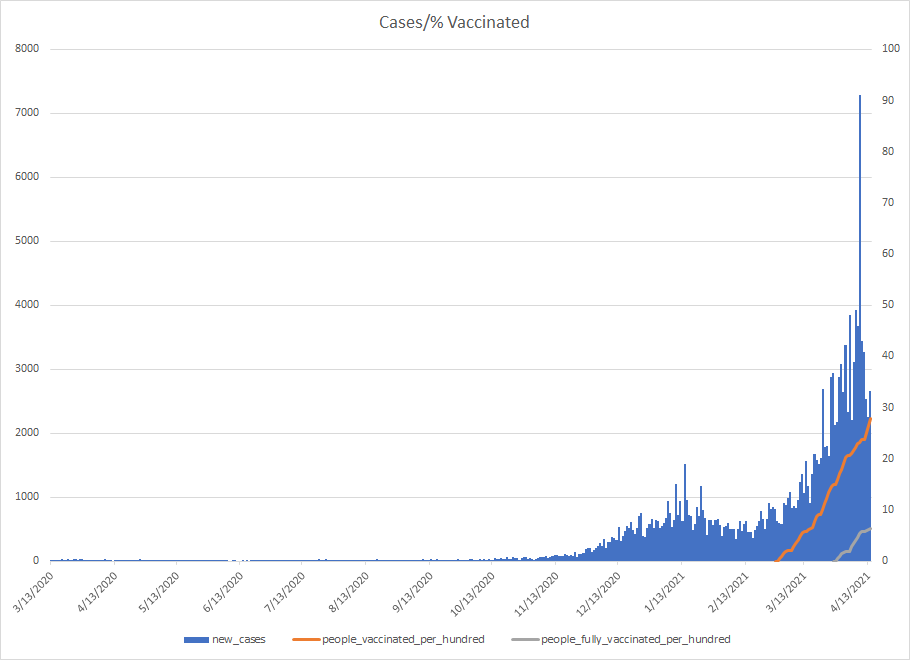
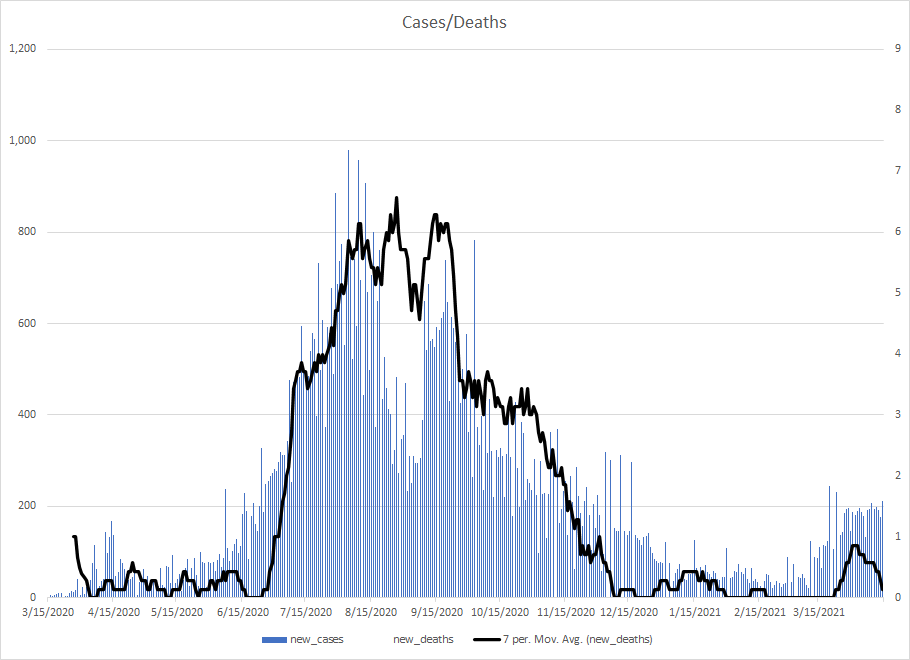
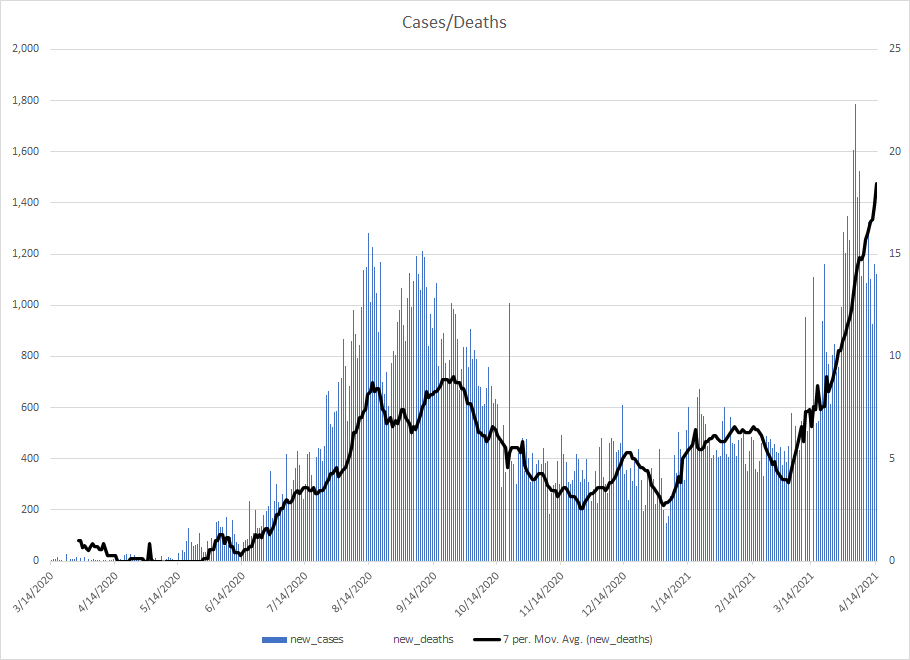
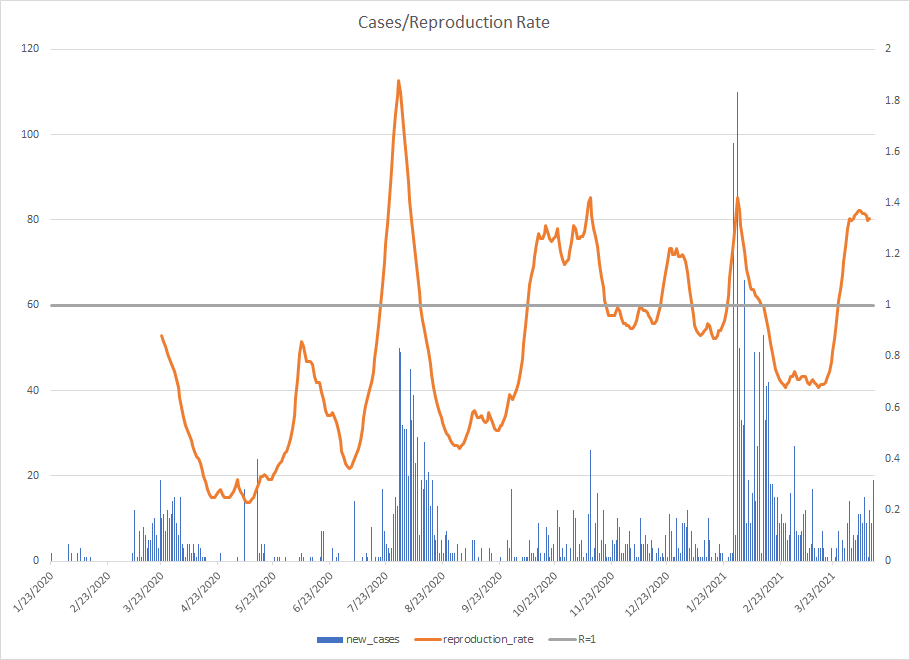
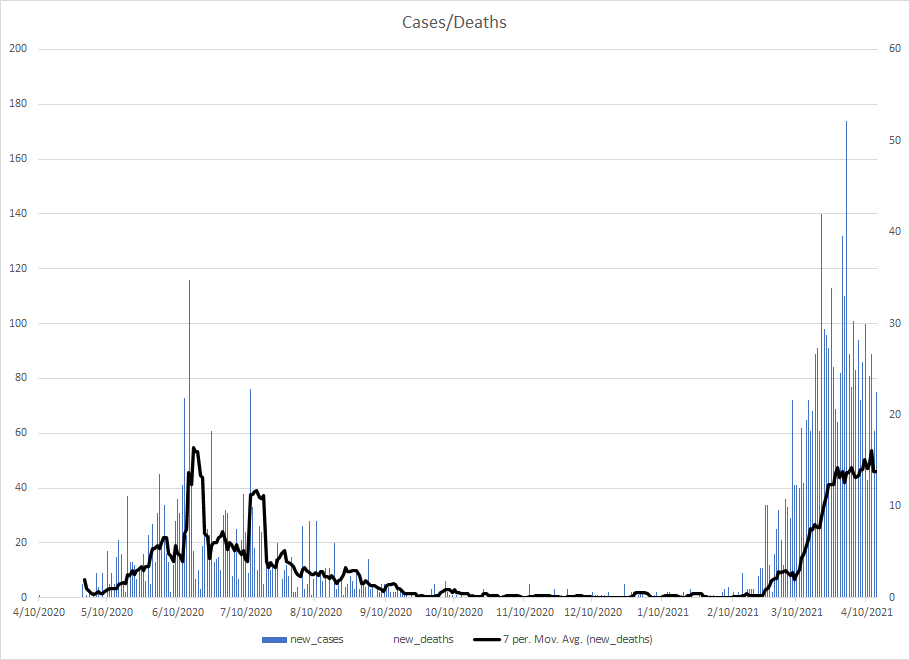
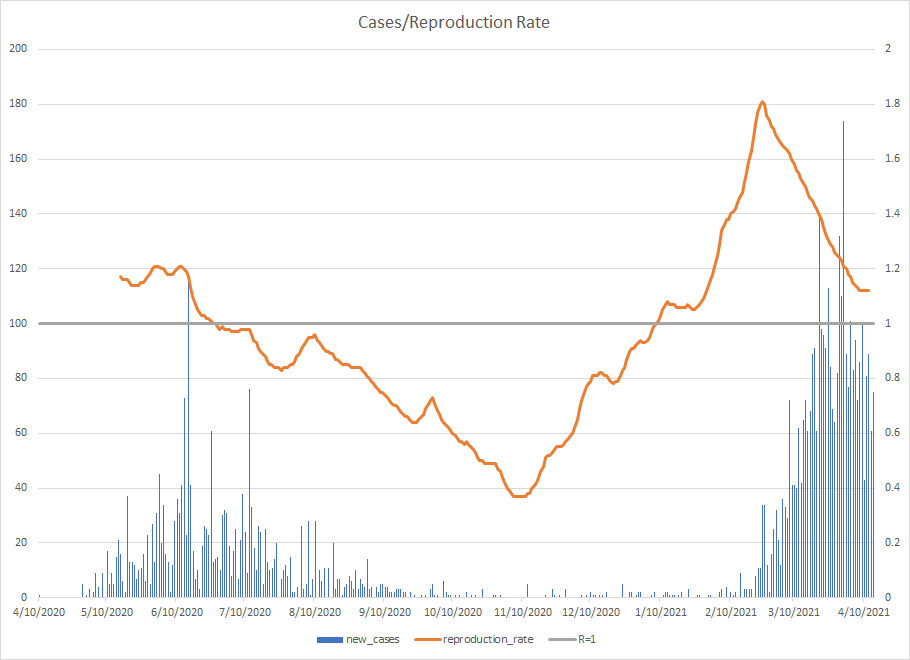
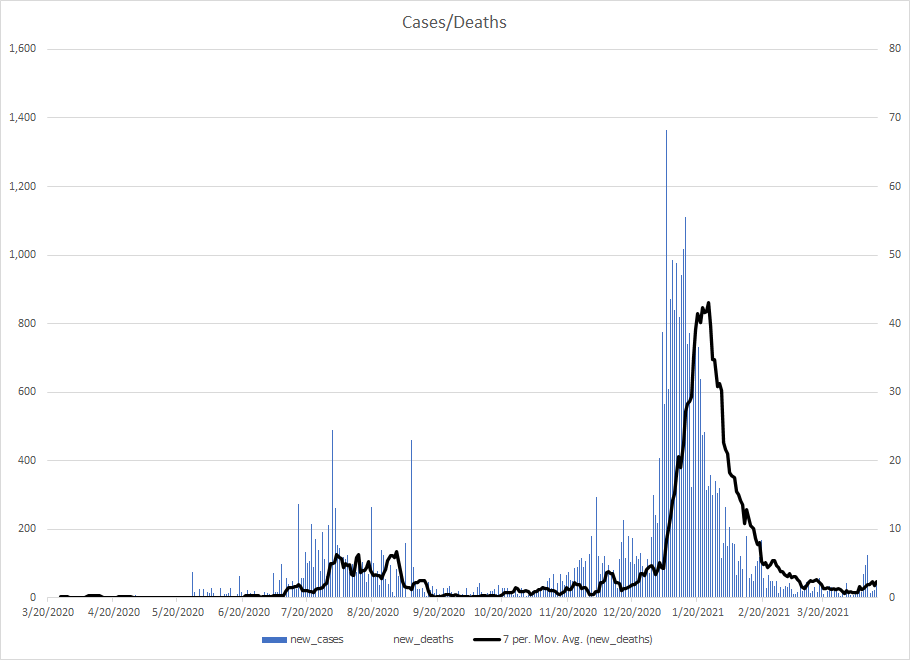
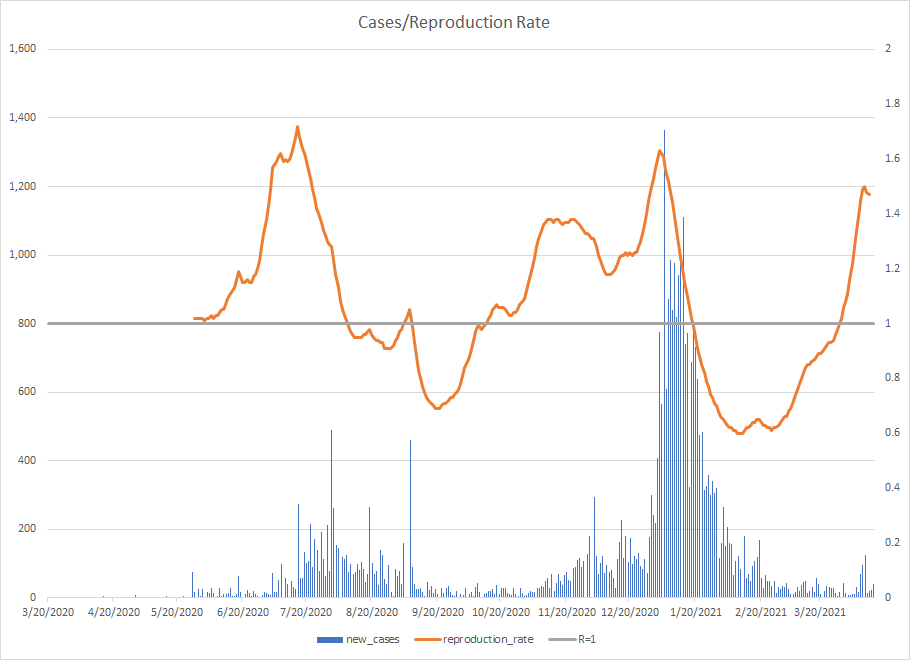
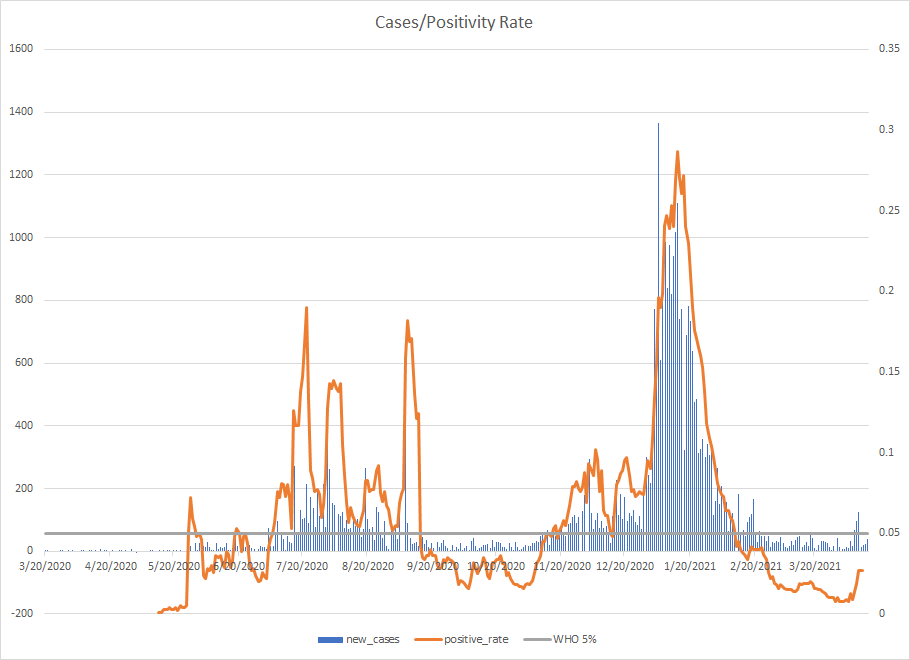
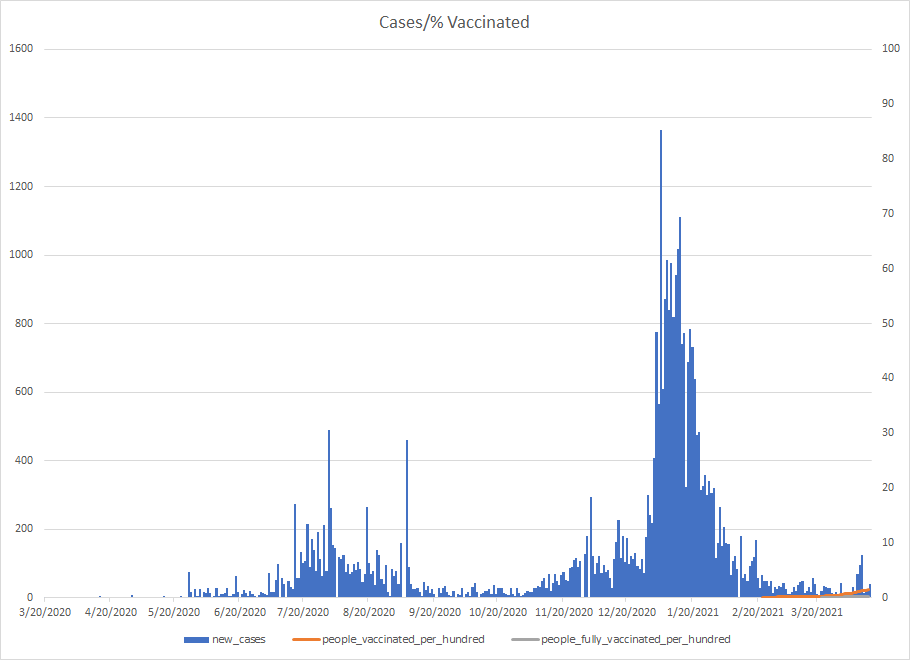
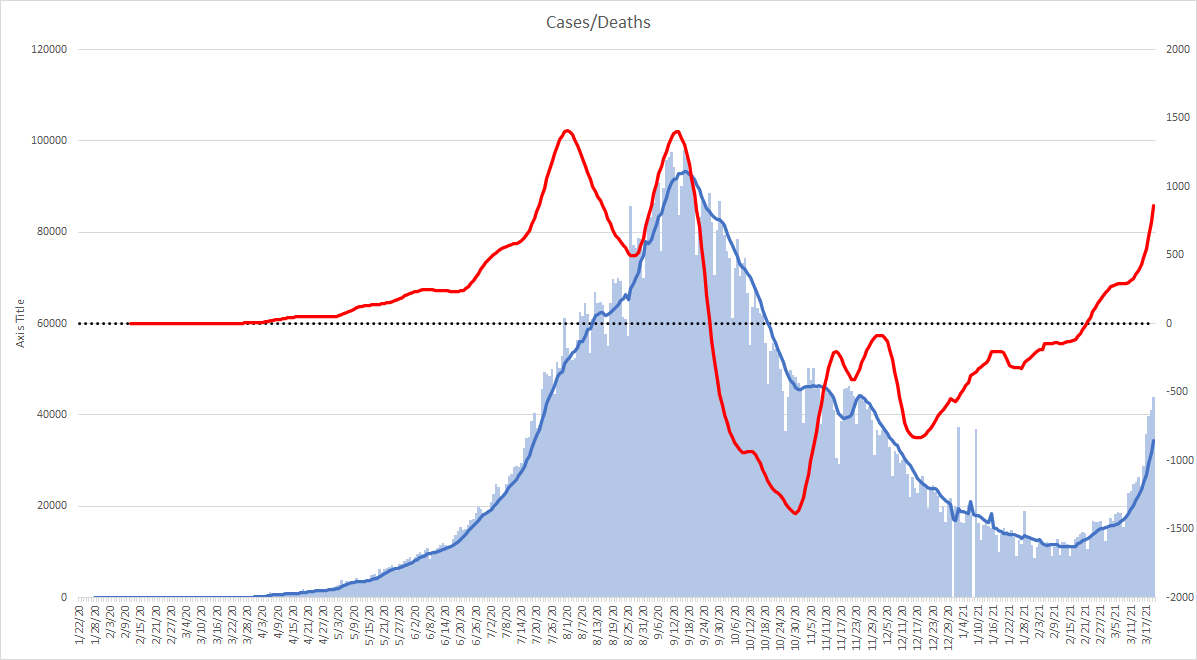
I’ve pulled together data together to provide up to five different graphs per country. Each one will have a basic epidemic curve of cases, and those will be represented on the scale on the left. Superimposed on each will be deaths, the transmission rate, the positivity rate, the hospitalization rate (and ICU use), and the percentage of the population having received one dose or having been fully vaccinated. Full data sets are obviously not going to be available for every country, so some will not have all five graphs. That’s simply a limitation of data availability.
It’s my opinion after having studied modern influenza pandemics that we are entering a very dangerous phase. We have become accustomed to waves of hospitalization and death, but it seems that most people simply don’t grasp the bigger problems that loom on the horizon. Our global supply chains are becoming more and more compromised (medications, silicon chips, etc.), social upheaval is underway (racial, socioeconomic, etc.), and economies are strained globally. This combination creates a tinderbox for conflict (Myanmar, Northern Ireland, Russia-Ukraine, Iran-Israel, etc.).
Afghanistan
Albania
Algeria
Andorra
Angola
Antigua and Barbuda
Argentina
Armenia
Australia
Austria
Azerbaijan
Bahamas
Bahrain
Bangladesh
Barbados
Belarus
Belgium
Belize
Benin
Bhutan
Bolivia
Bosnia and Herzegovina
Botswana
Brazil
Brunei
Bulgaria
Burkina Faso
Burundi
Cambodia
Cameroon
Canada
Cape Verde
Central African Republic
Chad
Chile
China
Colombia
Comoros
Congo
Costa Rica
Cote d’Ivoire
Croatia
Cuba
Cyprus
Czechia
Democratic Republic of Congo
Denmark
Djibouti
Dominican Republic
Ecuador
Egypt
El Salvador
Equatorial Guinea
Eritrea
Estonia
Eswatini
Ethiopia
Fiji
Finland
France
Gabon
Gambia
Georgia
Germany
Ghana
Greece
Grenada
Guatemala
Guinea
Guinea-Bissau
Guyana
Haiti
Honduras
Hungary
Iceland
India
Indonesia
Iran
Iraq
Ireland
Israel
Italy
Jamaica
Japan
Jordan
Kazakhstan
Kenya
Kosovo
Kuwait
Kyrgyzstan
Laos
Latvia
Lebanon
Lesotho
Liberia
Libya
Liechtenstein
Lithuania
Luxembourg
Madagascar
Malawi
Malaysia
Maldives
Mali
Malta
Mauritania
Mauritius
Mexico
Moldova
Monaco
Mongolia
Montenegro
Morocco
Mozambique
Myanmar
Namibia
Nepal
Netherlands
New Zealand
Nicaragua
Niger
Nigeria
North Macedonia
Norway
Oman
Pakistan
Palestine
Panama
Papua New Guinea
Paraguay
Peru
Philippines
Poland
Portugal
Qatar
Romania
Russia
Rwanda
Saudi Arabia
Senegal
Serbia
Sierra Leone
Slovakia
Slovenia
Somalia
South Africa
South Korea
South Sudan
Spain
Sri Lanka
Sudan
Suriname
Sweden
Switzerland
Syria
Taiwan
Tajikistan
Thailand
Timor
Togo
Trinidad and Tobago
Tunisia
Turkey
Uganda
Ukraine
United Arab Emirates
United Kingdom
United States
Uruguay
Uzbekistan
Venezuela
Vietnam
Yemen
Zambia
Zimbabwe
Sources
JHU CSSE COVID-19 Data European Centre for Disease Prevention and Control gov.UK Canada UK Tracker US Department of Health & Human Service Our World in Data
A second wave of COVID is rapidly spreading in India. Two things make this particularly alarming.
First, in the presence of a higher baseline prevalence, which means it can spread faster due to the exponential nature of transmission. This provides part of the reason why the climb appears to be happening considerably faster than the first wave.
I have suggested before that it would be wise to maintain a 3-6 month supply of any life-sustaining medications (insulin, cardiac medications, etc.) until the pandemic is over, or, in the words of Benjamin Franklin, “An ounce of prevention is worth a pound of cure.”
I haven’t written for awhile because it seems like people have become entrenched in their beliefs about the pandemic. I had been writing this most of the year in the hopes of convincing some people of just how serious this would become and to take precautions to limit the spread. That seems almost for naught now.
I’m concerned that what has been reported as a downturn is yet another illusion, as is the narrative that there wasn’t a spike related to Thanksgiving.
My thinking has to do with both the media and behavioral psychology. The data from the two weeks leading up to Thanksgiving were confounded by people both behaving more carefully because of intention to travel and also getting tested with that intention. In addition, media attention also raised awareness, which likely drove improved behavior.
The drop in cases over Thanksgiving is pretty self explanatory. Where it gets interesting though is the more recent drop. If people had been being more careful in preparation for Thanksgiving, that should also show up as a decrease three weeks later.
The vertical green line is two weeks before Thanksgiving, indicating where I guessed testing and caution would increase. The yellow vertical line is three weeks later, when that behavioral change, even for a short time, would have an impact. The red vertical line is three weeks after Thanksgiving, where I would have expected the holiday to have an impact. All of these interpretations are supported by the three week red curved case slope line, which is a measure of how fast these are accelerating or slowing, depending on how far above or below it is from the black dotted line. It’s fair to assume that the same kind of behavior would play out for Christmas.
The problem is that with people thinking that this represents a true decrease, those behaviors will reverse, causing another acceleration in the number of cases. Combining that with the most recent round of travel, the data suggests another major acceleration in case numbers around January 14th. This had me hoping that the harsh reality that was coming would finally convince those who have been denying this to start taking it seriously which might have had this under better control by March.
Unfortunately, two curve balls have come into the mix. Southern California (and other parts of the country) already have no ICU beds available and are having to be creative for additional regular hospital beds as well. Conversations around rationing care have already occurred around the country. Earlier this year, there were shortages of albuterol, and decisions had to be made around how to ration ECMO devices, which can simply be thought of as a bedside heart/lung bypass. California is experiencing problems with oxygen supplies as well as endotracheal (breathing) tubes. We are coming up against a breaking point soon from a supply chain for medical devices and pharmaceuticals as this continues to get out of control.
The other problem is the new strains that have been reported in the United Kingdom and in South Africa. The UK strain seems to have a much higher rate of transmission. It would be interesting to know the genetics of the current cases in California and Tennessee to determine the rapid rise in cases in those areas are the same strain.
The strain that has emerged in South Africa seems to affect younger populations much more adversely that what has been seen so far. That would also mean a greater need for hospitalization.
The biggest problem then lies with having the possibility of both of those strains superimposed on what we already have been experiencing. If that occurs, that means that the demands on healthcare will accelerate even more rapidly, bringing much of the country to the point that California has reached very quickly. That suggests that the worst of this may not begin until February or March, but of course, that’s just conjecture. There are so many variables in play now that it’s really anyone’s guess, but my money is on the worst winter most people have ever experienced. Wider vaccine availability cannot come soon enough.